Fig. 2.
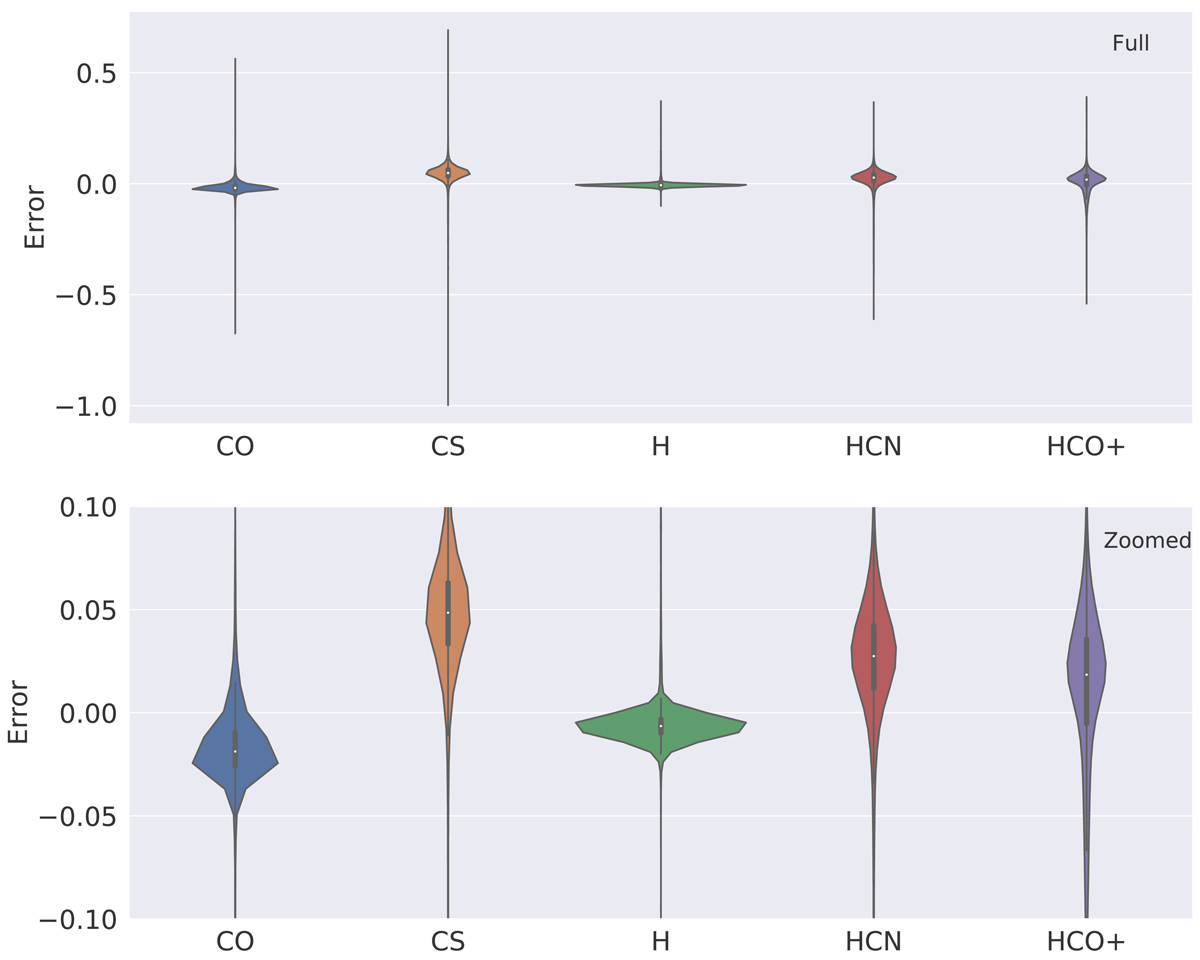
Violin plot of the distribution of the difference between the log10 abundance predictions from the astrochemical models and those from the emulator using a kernel density estimate from the 10 000 simulations in the validation dataset for CO, CS, H, HCN, and HCO+. Bottom plot: zoomed-in version of the top plot. Bottom plot: thick black lines represent the interquartile range and the thin black line the 95% confidence interval.
Current usage metrics show cumulative count of Article Views (full-text article views including HTML views, PDF and ePub downloads, according to the available data) and Abstracts Views on Vision4Press platform.
Data correspond to usage on the plateform after 2015. The current usage metrics is available 48-96 hours after online publication and is updated daily on week days.
Initial download of the metrics may take a while.