Fig. 2
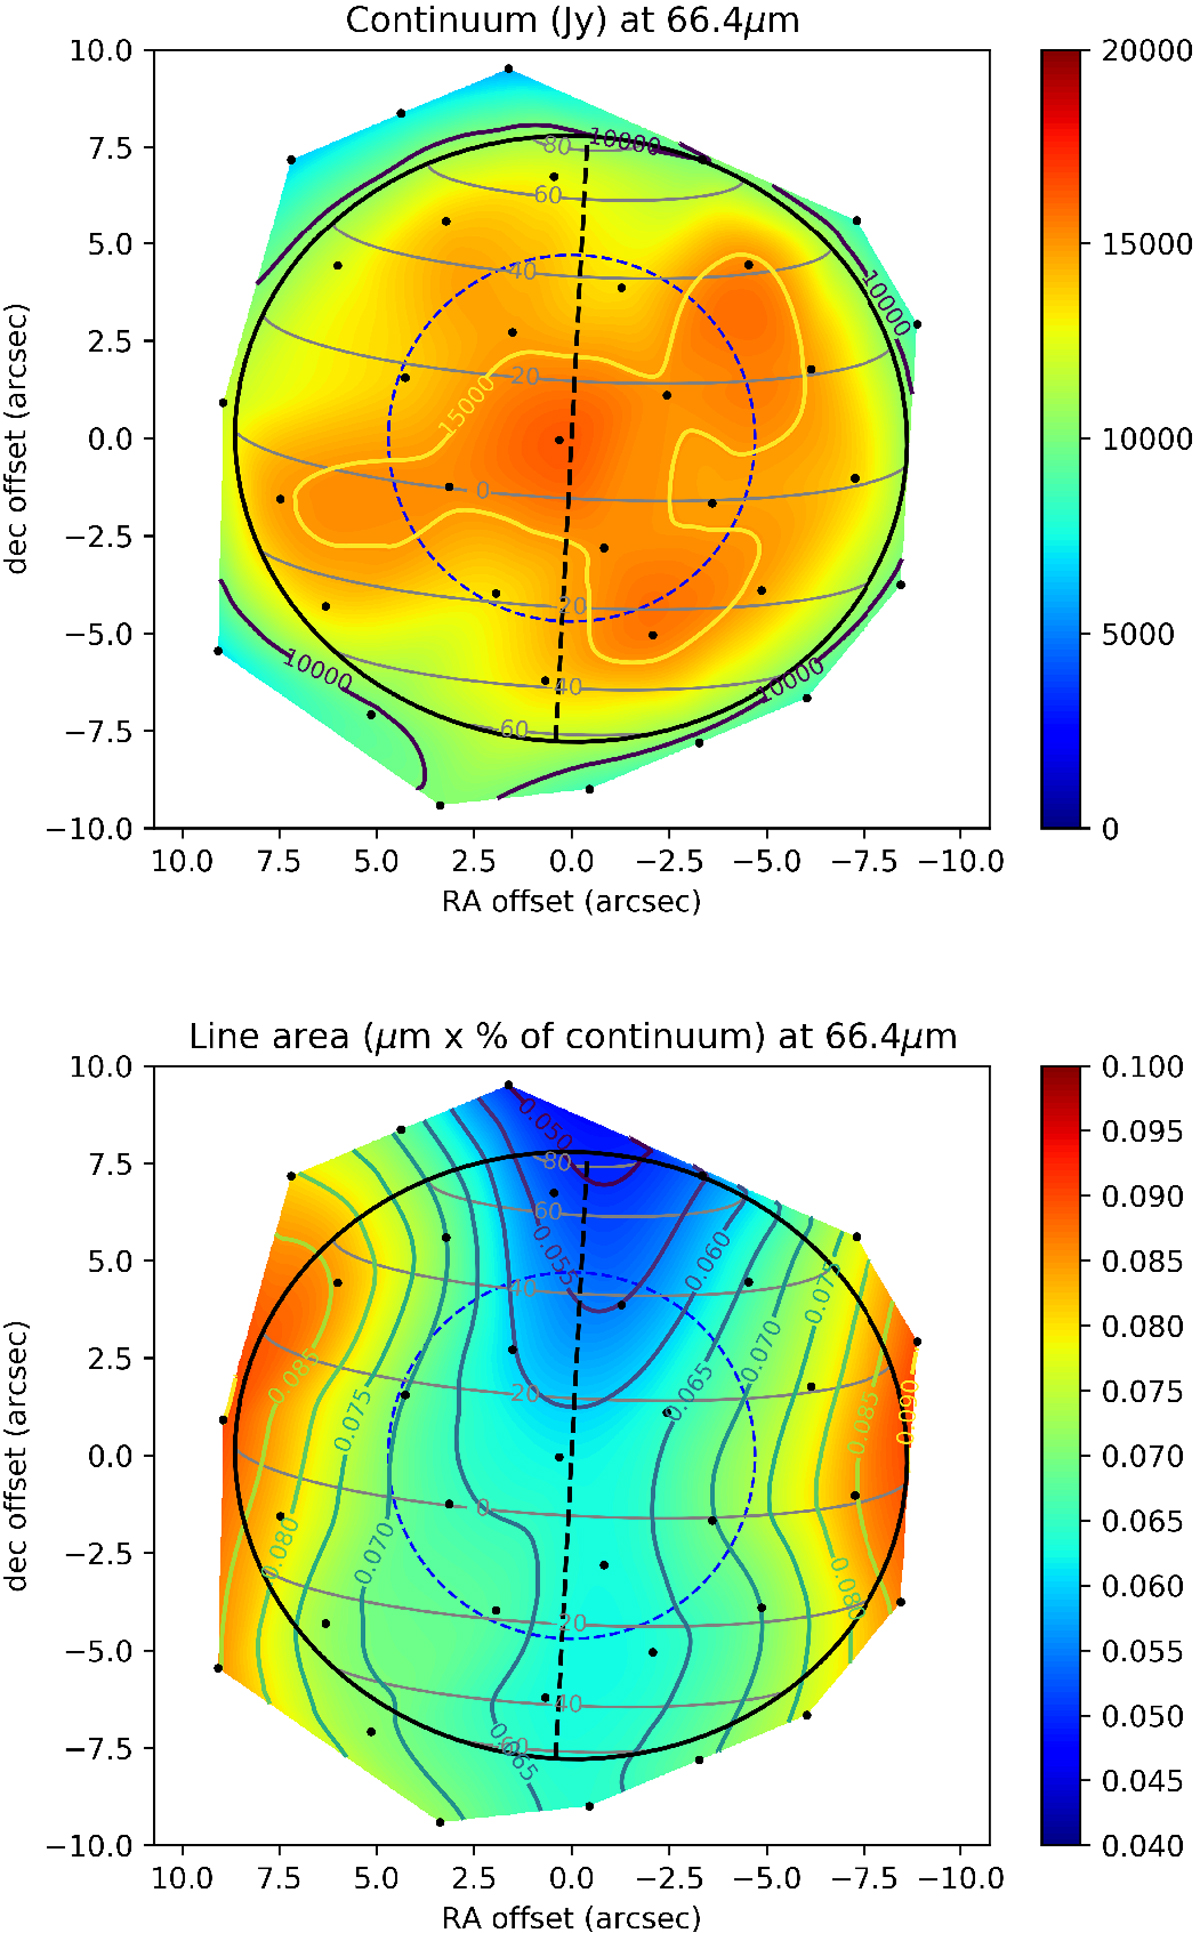
Water map at 66.44 μm observed bythe PACS spectrometer on January 2, 2011. Saturn is represented by the black ellipse and its rotation axis is shown with a black dashed line. Iso-latitudes are plotted with gray lines. The beam is represented by a blue dashed circle. Each black dot represents the central position of a pixel of the raster map. Top: image of the continuum (in Jy), after the residual pointing offset was corrected. Bottom: the line area in microns × % of the continuum is shown.
Current usage metrics show cumulative count of Article Views (full-text article views including HTML views, PDF and ePub downloads, according to the available data) and Abstracts Views on Vision4Press platform.
Data correspond to usage on the plateform after 2015. The current usage metrics is available 48-96 hours after online publication and is updated daily on week days.
Initial download of the metrics may take a while.