Fig. B.2.
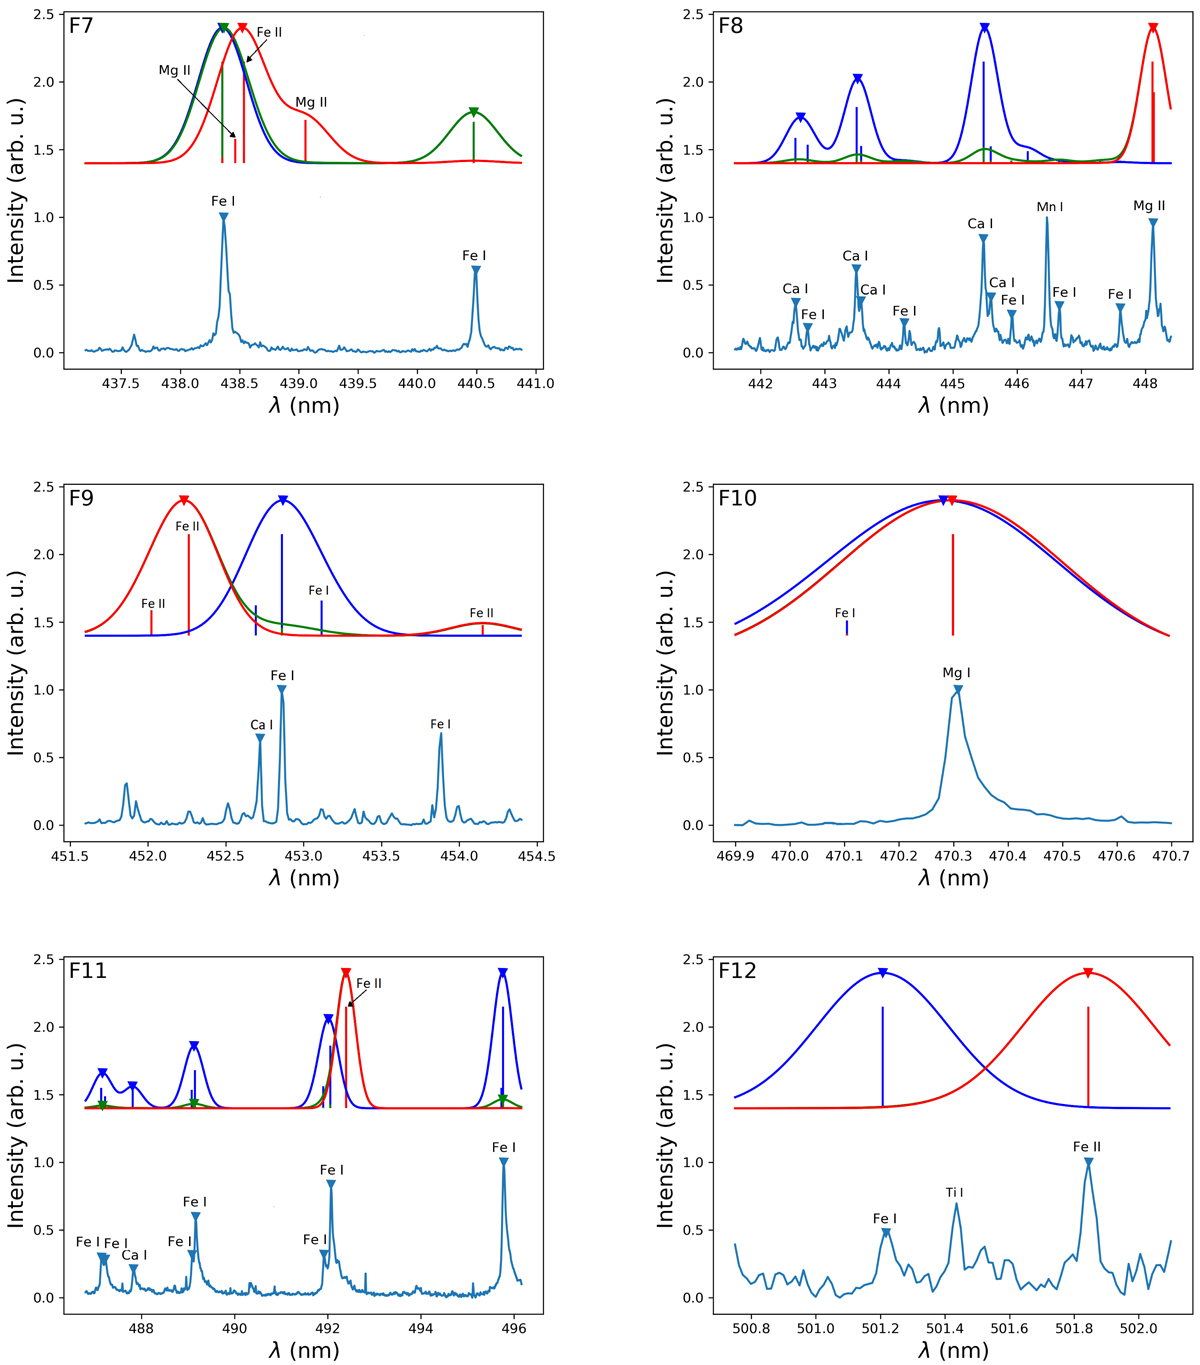
Spectral features F7–F12. Upper part: synthetic spectra calculated under different temperatures: blue shows 4000 K, green shows 7000 K, and red shows 10 000 K. The intensity of each of these spectra is scaled to 1. Lower part: high-resolution emission spectrum of the meteorite laser ablation plasma. Each marked peak is listed in Table A.1
Current usage metrics show cumulative count of Article Views (full-text article views including HTML views, PDF and ePub downloads, according to the available data) and Abstracts Views on Vision4Press platform.
Data correspond to usage on the plateform after 2015. The current usage metrics is available 48-96 hours after online publication and is updated daily on week days.
Initial download of the metrics may take a while.