| Issue |
A&A
Volume 670, February 2023
|
|
|---|---|---|
| Article Number | L13 | |
| Number of page(s) | 6 | |
| Section | Letters to the Editor | |
| DOI | https://doi.org/10.1051/0004-6361/202245462 | |
| Published online | 14 February 2023 | |
Letter to the Editor
Laboratory modeling in laser-induced plasma to estimate the pressure in bolide wake
1
Laboratory of Astrochemistry, Department of Chemistry, Lomonosov Moscow State University, 119234 Moscow, Russia
2
Division of Laser Chemistry, Department of Chemistry, Lomonosov Moscow State University, 119234 Moscow, Russia
e-mail: This email address is being protected from spambots. You need JavaScript enabled to view it.
Received:
14
November
2022
Accepted:
20
January
2023
Abstract
Aims. We study Fe and FeO emission in laser-induced plasma under reduced pressure to develop an approach for finding the conditions under which the laboratory plasma state matches the state of bolide wake plasma.
Methods. To acquire spectra of laser-induced plasma, we ablated a target of Fe3O4 in a vacuum chamber using a Q-switched laser. The Boltzmann plot method and Stark broadening of the emission lines were used to estimate the plasma temperature and electron number density. The intensity ratios of two Fe I lines (544.61 nm and 558.69 nm) to the intensity of FeO orange band at 587.1 nm were calculated to compare the conditions in laser-induced plasma and bolide wake plasma.
Results. Several combinations of pressure (75–150 Torr) and delay (12–15 μs) lead to the highest degree of similarity between laser-induced plasma and the Beneov bolide spectra at an altitude of 39 km. Importantly, the plasma parameters and pressure are consistent at these points. A detailed comparison of the spectra shows that the best-match conditions are 100 Torr and 15 μs. This pressure is ≈25 times higher than the ambient pressure at this altitude.
Conclusions. We assume that the pressure in the bolide wake is higher than the ambient pressure by a factor of 20–30. This can be considered to be the upper bound estimate of the pressure in the bolide wake, and the developed approach would be beneficial to support the modeling of a meteoroid entry.
Key words: plasmas / meteorites / meteors / meteoroids / methods: laboratory: atomic / methods: laboratory: molecular / techniques: spectroscopic
© The Authors 2023
 Open Access article, published by EDP Sciences, under the terms of the Creative Commons Attribution License (https://creativecommons.org/licenses/by/4.0), which permits unrestricted use, distribution, and reproduction in any medium, provided the original work is properly cited.
This article is published in open access under the Subscribe-to-Open model. This email address is being protected from spambots. You need JavaScript enabled to view it. to support open access publication.
1. Introduction
Discovering the relations between meteorite classes and asteroid types is one important area of study in planetary science (Binzel et al. 2002; Chapman 2004; DeMeo et al. 2022). The study of meteorites and meteoroids that have already impacted the Earth is a widely used approach to reveal these relations and to obtain valuable information about the asteroid from which the meteoroid derived (Brown et al. 2011; Popova et al. 2011). In addition to benefits for the study of near-Earth objects, a good understanding of an impact event such as that in Chelyabinsk provides an opportunity to develop hazard mitigation strategies for planetary defense (Popova et al. 2013). The entry of a meteoroid results in the formation of a shock wave of a certain configuration that depends on the particular structure, size, and composition of the meteoroid. Its interaction with the body of the meteoroid during entry results in meteoroid fragmentation. The interaction of shocks and wakes at small distances between fragments may influence the vapor-mixing process (Artem’eva & Shuvalov 1996).
Both molecular and atomic emission of different species are present in the spectra of meteors in bolide and wake phases (Borovička & Spurný 1996; Jenniskens et al. 2000). One of the most abundant chemical elements in meteor bodies is iron (Jenniskens 2007), which is present in the form of metal in the case of iron meteors, or in the form of various minerals in the case of chondrites (Mason 1963). Thermodynamic calculations show that neutral Fe and iron monoxide FeO are the predominant Fe-containing species in the cloud that forms during the meteor event (Berezhnoy 2018). Although the temperature in the bolide core may reach 95 000 K (Silber et al. 2018), a relatively low temperature (2000–4000 K) is typical for wake-phase plasma (Berezhnoy & Borovička 2010), allowing for the existence, excitation, and therefore observation of both atomic Fe lines and FeO molecular bands. Although emission of other chemical elements such as Mg, Al, and Ca and of their monoxides has also been observed in meteor spectra, Fe and FeO emission dominates, especially in the spectral region from 450 to 600 nm, which is available in high resolution for the Benešov bolide (EN070591; Borovička & Spurný 1996).
The study of the dynamics of meteor events requires knowledge of the column densities and radiative parameters of molecular excited states. The availability of the latter is extremely low for FeO due to the extreme complexity of its rovibronic states and corresponding transitions (Sakellaris et al. 2011). Experimental studies of emission spectra and laboratory simulations of their temporal evolution during meteor events are promising approaches. Meteor spectra have been compared with the spectra of laboratory plasma produced via the laser ablation of meteorites (Křivková et al. 2021; Milley et al. 2007; Ferus et al. 2019; Popov et al. 2021), high-enthalpy plasma flow systems (Drouard et al. 2018; Helber et al. 2019), or by arc heater (Agrawal et al. 2018). West & Broida (1975) obtained chemiluminescence spectra of FeO that were later subtracted by Berezhnoy et al. (2018) from Benešov bolide spectra, which enabled separation and study of the CaO contribution. However, chemiluminescence spectra were obtained at low temperature (700 K), while the temperature estimates for bolide wake plasma are significantly higher (2000–4000 K; Berezhnoy & Borovička 2010). Another effort by Popov et al. (2021) demonstrated the applicability of laser-induced breakdown spectrometry (LIBS) to simultaneous simulations of both molecular and atomic components of meteor spectra. A less frequently studied problem is the influence of pressure on the observed spectra. The spectra of laser plasma induced by ablation of Fe3O4 under reduced pressure show a significantly higher intensity ratio of Fe to FeO than the bolide spectra (Zakuskin et al. 2021). Moreover, the computed spectra of a Benešov-like bolide, assuming the density in the cloud to be close to the undisturbed atmospheric density, demonstrated the significant discrepancy of the intensity of Fe lines between the model and observations (Borovicka et al. 1998). We should also point out that the available laboratory spectra were obtained under conditions far from those corresponding to the processes of impact events.
An important feature of laser-induced plasma (LIP) is the available temperature T (0.2–4 eV) and electron number density Ne (1014 − 1019 cm−3) range. Therefore, plasma like this is an ideal source for laboratory modeling under suitable conditions to study radiation from various objects in outer space. The essence of the method is to obtain LIP spectra under conditions similar to those at different meteor observation heights. It is also evident that the experiments at atmospheric pressure (Popov et al. 2021) do not allow a full simultaneous reconstruction of the meteor spectrum shape for atomic and molecular features. We therefore study Fe and FeO in LIP under reduced pressure here to develop a meaningful approach for finding the plasma state that reproduces the meteor plasma at a given altitude. A comparison of LIP and meteor spectra helps us to understand meteor events dynamics and its possible influence on the ablation and fragmentation of space objects better.
2. Experimental
To produce LIP, we used the second-harmonic radiation (λ = 532 nm) of a Q-switched (pulse duration ≈6 ns) Nd:YAG laser. The laser radiation was focused using an achromatic doublet on the surface of a sample, placed in a vacuum chamber. The pulse energy was ≈8.12 mJ, which corresponds to a power density of ≈8.12 GW cm−2. We used a two-lens condenser to collect plasma emission onto the end of an optical fiber bundle (seven fused silica fibers of 200 μm core size, linear to linear). The second end of the bundle projected the radiation onto the 50 μm slit of a Cherny-Turner spectrometer MS5204i (SOL Instruments, Belarus), which provided a resolving power of 16 000 at 600 nm (grating with 1800 gr mm−1) for the acquisition of spectra for plasma diagnostics. A diffraction grating with 300 gr mm−1 was used for spectra in the range of FeO bands to capture a wider spectral range and to achieve a resolution close to the resolution of Benešov spectra. The spectra were recorded by the gated iCCD camera Nanogate-2B (“Nanoscan”, Russia). To observe the evolution of the plasma, we recorded its spectra at various delays after the laser pulse. We maintained a gate-to-delay ratio of 1/10 for all measurements. For the lowest pressure (3.75 Torr), typical delays were around 1 μs, while for higher pressure (75–200 Torr), the delay varied from 10 to 50 μs. The pressure inside the vacuum chamber was monitored by a digital Pirani gauge (Erstvak, Russia).
We used a high-purity Fe3O4 (Sigma Aldrich, 99.99 mass %) powder pressed into pellets with a diameter of 12 mm under 470 MPa pressure as a target. The samples were fixed on a rotating holder, which ensured the movement of the ablation point along the surface of the target.
3. Plasma diagnostics
The Boltzmann plot method and Stark broadening of emission lines are well suited for the diagnostics of LIP to retrieve its temperature T and electron number density Ne (Aragón & Aguilera 2008). We may expect local thermodynamic equilibrium (LTE) in plasma down to 1 Torr, according to earlier studies on the fulfillment of the McWhirter criterion (Huddlestone & Leonard 1965) and reported by Cristoforetti et al. (2004) results on study of LTE existence in LIP under different pressures.
Excitation temperature and electron number density were calculated as described earlier (Zakuskin et al. 2019; Zaytsev et al. 2019). We derived the temperature using the Boltzmann plot (Fig. A.1) method according to the equation
 (1)
(1)
where  is the energy of the upper level for a given transition, I is the integral intensity calculated by the approximation of the line profile with the Lorentz function, λji is the transition wavelength, gj is the degeneracy of the upper level, Aji is the transition probability, and kB is the Boltzmann constant. To construct the Boltzmann plot, we selected 20–30 atomic Fe lines in the spectral region from 510 to 524 nm (Fig. A.1). We used the
  , λji, gj, and Aji values for all transitions taken from the NIST Atomic Spectra Database (Kramida et al. 2022). The electron number density was measured using the Stark broadening of the Fe I 538.34 nm line (electron-impact full width at half maximum, FWHM, parameter of 0.145 nm at an electron density Ne = 1017cm−3 according to Zaytsev et al. 2019). We neglected the influence of both ion broadening and Doppler broadening because their effect on the considered emission lines is negligibly small (Popov et al. 2016).
4. Results
4.1. Comparison of bolide spectra and spectra of LIP at low pressure
The spectra of the Benešov bolide obtained in 1991 were described in detail in several works (Borovička & Spurný 1996; Borovička & Berezhnoy 2016; Popov et al. 2021) with an emphasis on different aspects. The bolide wake spectrum at an altitude of 39 km has been investigated becausee its Fe and FeO features are intense, while the Ca and CaO signals are weaker than in spectra at other altitudes (Berezhnoy et al. 2018). We recorded spectra of LIP in the spectral region from 540 to 615 nm at a pressure of 3.75 Torr, which corresponds to this altitude. The meteor and LIP spectra exhibited significant differences. The experimental spectra contain a large number of high-intensity Fe atomic lines. Emission of the FeO orange bands is also present and is significantly weaker than the atomic lines (Fig. 1). Although the cumulative shape of the FeO molecular band in the experimental spectrum matches the profile in the bolide spectrum, the relative intensity of the atomic lines in the LIP spectrum is orders of magnitude higher.
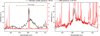 |
Fig. 1. Spectra of the Benešov bolide wake at 39 km (black) and LIP at 3.75 Torr (red), which corresponds to an altitude of 39 km: Overview in the spectral range of 555–614 nm (left), and detailed view of the FeO orange band region (right). |
The comparison of the Beneov spectrum and spectra of LIP at all delays under low pressure urge us to suggest that the main contribution to the observed discrepancy comes from the difference in pressure of bolide wake plasma at the given altitude (39 km) and the experimental plasma at the corresponding pressure (3.75 Torr). Usually, the aerodynamic pressure in front of the bolide is equated to some constant, describing the strength of meteoroid material at the point when the destruction of a meteoric body begins (Popova et al. 2013). According to this assumption, the pressure at 39–45 km is found to be equal to 0.7–1.7 MPa for other events (Brown et al. 2011; Popova et al. 2011, 2013; Borovička et al. 2013). Simulations show that the pressure decreases rapidly with increasing distance from the front, but significant overpressure still remains at a distance of a few meters behind the body of the Benešov bolide (Johnston et al. 2021; Borovicka et al. 1998). Thus, we can assume that a significant fraction of wake luminosity originated from the overpressurized zone. At the same time, it is known that LIP rapidly (1–5 μs) reaches pressure equilibrium with the surrounding atmosphere (Hermann et al. 2018a,b) except for a thin layer of the shock wave, which is far from the luminous plasma after the equilibration (Shabanov & Gornushkin 2014). With these assumptions, we performed an experimental search for the conditions that would ensure a high degree of agreement between the bolide wake and LIP spectra. Since atomic emission dominates at low pressure (0.16–10.5 Torr), we selected the range from 75 to 200 Torr for further investigations. Higher pressure might provide more collision-dominated conditions and higher oxygen concentration in the LIP, resulting in an equilibrium shift toward the formation of FeO, and therefore, a higher contribution of molecular emission to the cumulative spectrum.
4.2. Criterion of spectrum similarity
In order to determine the optimal conditions under which the LIP spectra match the spectra of the wake of the Benešov bolide, we propose a criterion based on the intensities of the atomic lines and the FeO band. We calculated the ratios of the intensities of two Fe I lines (544.61 nm and 558.69 nm) to the intensity of the FeO band at 587.1 nm and plot these ratios along the x- and y-axes in the left panel of Fig. 2. The choice of atomic lines is based on the large difference between the energies of the upper levels of the transitions (3.3 eV and 5.6 eV, respectively) and the fact that they are expected to be free from spectral interferences and self-absorption1. The wavelength of the molecular band corresponds to a local maximum that is free from interferences of the Fe atomic lines and the Ca and CaO signals present in bolide spectra. The criterion takes both excitation temperature and equilibrium between atomic and molecular species into account. It is unreasonalbe to require the fulfillment of a stricter criterion, including many lines and/or a point-to-point spectrum comparison because the resolutions of the bolide and laboratory spectra differ and other chemical elements are present in unknown ratios in the bolide plasma.
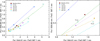 |
Fig. 2. Criterion of spectrum similarity in the space of two ratios of the atomic line to the molecular band. Left: all investigated points in the pressure range 75–200 Torr and delay range 7–20 μs. Right: experimental points providing the highest similarity between the laboratory and meteor spectra. |
Figure 2 shows the calculated values of the criterion variables plotted for all investigated combinations of pressure and delay and the same for the spectrum of the Benešov bolide wake at the 39 km altitude (black square). Although the ratios are related (dashed lines added for convenience), the variation in pressure and delay allows the observation of LIP within a wide range of plasma parameters that govern excitation processes and chemical reactions. Comparison of the experimental points with the points of the bolide spectrum narrowed down the range of pressure and delay within which LIP spectra remain similar to each other and match the meteor spectra best according to the criterion. Five points are located closest to the bolide point in the space of our variables (right panel of Fig. 2), and they were considered for a more detailed investigation and comparison.
The LIP spectrum at a pressure of 100 Torr and 15 μs delay is very similar to the Benešov spectrum at an altitude of 39 km (Fig. 3). The conditions in LIP were clearly close to those in the meteor plasma. This is indicated by the similarity of the molecular band profile and the relative intensities of the Fe atomic lines and FeO bands. The only significant remaining difference is attributed to the Ca I lines near 560 nm, at 551.30 nm, and beyond 600 nm. These signals are present only in the bolide spectra because our ablation target consists only of Fe3O4.
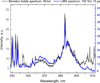 |
Fig. 3. LIP spectrum (100 Torr, 15 μs) with the highest degree of similarity with the spectrum of the wake of the Benešov bolide at 39 km. |
4.3. Results of plasma diagnostics
We performed a plasma diagnostics procedure for the points that meet the proposed criterion (see Fig. 2 (right) and Table 1). The results show that the plasma parameters in all cases (from 75 Torr, 15 μs to 150 Torr, 15 μs) differ insignificantly and lie within 4800–5400 K for the temperature and 1.6 × 10¹⁵ to 5.4 × 1015 cm−3 for the electron number density. The widths of these ranges are comparable to the error margins for the determination of the plasma parameters, so that the suggested criterion provides a reliable selection of the plasma conditions that match the meteor plasma. Based on the results shown in Fig. 2 (left) and in Table 1, we conclude that the delay before recording the LIP spectra has a greater influence on plasma parameters and spectrum shape (see Fig. B.1), while the pressure dependence is weaker. In our case, conditions at pressures from 75 to 150 Torr (2 times difference) at a constant delay of 15 μs provide suitable results, but a detailed visual spectra examination allows us to identify the 15 and 12 μs delay spectra at 100 Torr pressure as the best-match conditions for the Benešov spectrum at 39 km. We consider it extremely important that the developed criterion allowed us to identify a set of conditions (combinations of pressure and delay) under which the plasma parameters are similar within the error margins.
Results of plasma diagnostics.
5. Conclusions
Our research demonstrates the advantages of LIP modeling of processes during impact events because the range of ambient pressure and plasma parameters available for spectrum acquisition is fairly wide. The equilibrium of LIP at undisturbed atmospheric pressure, corresponding to the altitude of the Benešov observation, is significantly shifted toward atomic species, causing huge discrepancies in the spectrum profiles. Therefore, we assume that the main fraction of bolide wake emission originates from the zone in which the pressures are significantly higher than the pressure of the undisturbed atmosphere. Because the pressure inside the LIP is close to the ambient pressure (Shabanov & Gornushkin 2014; Hermann et al. 2018a,b) after 3–5 μs of evolution, the pressure value becomes a characteristic property of the plasma. Therefore, the pressure providing the best similarity of laboratory and bolide spectra can be used as an estimate of the pressure in the wake of the luminous bolide.
The suggested criterion of spectrum similarity based on the ratios of two atomic line to molecular band revealed the range of experimental conditions in which the laboratory spectra were close to the spectrum of the Benešov bolide. This is reliable due to the built-in accounting for the excitation temperature and the ratio of atomic and molecular species. Plasma diagnostics confirms that within the range of 75–150 Torr, the conditions in the LIP do not differ noticeably, and that they are therefore a reliable estimate for the conditions present in the Benešov bolide wake at the altitude of 39 km. We assume that the pressure in the bolide wake is also higher than the ambient pressure (with an upper estimate of 20–30 times higher). This estimate would be useful to support the modeling of the meteoroid entry because the possible excessive pressure is several times higher than the pressure of undisturbed media, but its absolute value is lower than 1% of the meteor shock-layer pressure, which is usually retrieved from the study of bolide fragmentation and meteorite physical properties. Understanding the peculiarity of bolide wake conditions and LIP simulation of meteor spectra in general opens a path for improvements in the study of meteor entry dynamics and chemical transformations by means of atomic and molecular spectroscopy.
Acknowledgments
We would like to thank Dr. Borovička for encouraging our interest in meteor study and for helpful comments at early stages of discussion. The work was supported by the Russian Science Foundation (RSF) (grant #18-13-00269-Π)
References
- Agrawal, P., Jenniskens, P. M., Stern, E., Arnold, J., & Chen, Y. K. 2018, in 2018 Aerodynamic Measurement Technology and Ground Testing Conference, AIAA 2018-4284 [Google Scholar]
- Aragón, C., & Aguilera, J. A. 2008, Spectrochim. Acta Part B: Atomic. Spectrosc., 63, 893 [CrossRef] [Google Scholar]
- Artem’eva, N. A., & Shuvalov, V. V. 1996, Shock Waves, 5, 359 [CrossRef] [Google Scholar]
- Berezhnoy, A. A. 2018, Icarus, 300, 210 [NASA ADS] [CrossRef] [Google Scholar]
- Berezhnoy, A. A., & Borovička, J. 2010, Icarus, 210, 150 [NASA ADS] [CrossRef] [Google Scholar]
- Berezhnoy, A. A., Borovička, J., Santos, J., et al. 2018, Planet. Space Sci., 151, 27 [Google Scholar]
- Binzel, R. P., Lupishko, D. F., Di Martino, M., Whiteley, R. J., & Hahn, G. 2002, in Asteroids III, eds. W. F. Bottke Jr., A. Cellino, P. Paolicchi, & R. P. Binzel (Tucson, USA: University of Arizona Press), 255 [Google Scholar]
- Borovička, J., & Berezhnoy, A. A. 2016, Icarus, 278, 248 [CrossRef] [Google Scholar]
- Borovička, J., & Spurný, P. 1996, Icarus, 121, 484 [CrossRef] [Google Scholar]
- Borovicka, J., Popova, O., Golub, A., Kosarev, I., & Nemtchinov, I. 1998, A&A, 337, 591 [NASA ADS] [Google Scholar]
- Borovička, J., Spurný, P., Brown, P., et al. 2013, Nature, 503, 235 [NASA ADS] [Google Scholar]
- Brown, P., McCausland, P. J. A., Fries, M., et al. 2011, Meteorit. Planet. Sci., 46, 339 [Google Scholar]
- Chapman, C. R. 2004, Annu. Rev. Earth Planet. Sci., 32, 539 [CrossRef] [Google Scholar]
- Cristoforetti, G., Legnaioli, S., Palleschi, V., Salvetti, A., & Tognoni, E. 2004, Spectrochim. Acta Part B: Atomic Spectrosc., 59, 1907 [NASA ADS] [CrossRef] [Google Scholar]
- DeMeo, F. E., Burt, B. J., Marsset, M., et al. 2022, Icarus, 380, 114971 [NASA ADS] [CrossRef] [Google Scholar]
- Drouard, A., Vernazza, P., Loehle, S., et al. 2018, A&A, 613, A54 [NASA ADS] [CrossRef] [EDP Sciences] [Google Scholar]
- Ferus, M., Kubelík, P., Petera, L., et al. 2019, A&A, 630, A127 [NASA ADS] [CrossRef] [EDP Sciences] [Google Scholar]
- Helber, B., Dias, B., Bariselli, F., et al. 2019, ApJ, 876, 120 [NASA ADS] [CrossRef] [Google Scholar]
- Hermann, J., Axente, E., Craciun, V., Taleb, A., & Pelascini, F. 2018a, Spectrochim. Acta Part B: Atomic Spectrosc., 143, 63 [NASA ADS] [CrossRef] [Google Scholar]
- Hermann, J., Grojo, D., Axente, E., & Craciun, V. 2018b, Spectrochim. Acta Part B: Atomic Spectrosc., 144, 82 [NASA ADS] [CrossRef] [Google Scholar]
- Huddlestone, R. H., & Leonard, S. L. 1965, Plasma Diagnostic Techniques, Pure and Applied Physics (New York: Academic Press), 627 [Google Scholar]
- Jenniskens, P. 2007, AdSpR, 39, 491 [NASA ADS] [Google Scholar]
- Jenniskens, P., Lacey, M., Allan, B. J., Self, D. E., & Plane, J. 2000, FeO "orange arc" Emission Detected in Optical Spectrum of Leonid Persistent Train (New York: Springer), 429 [Google Scholar]
- Johnston, C. O., Stern, E. C., & Borovička, J. 2021, Icarus, 354, 114037 [NASA ADS] [CrossRef] [Google Scholar]
- Kramida, A., Ralchenko, Yu., Reader, J., & NIST ASD Team 2022, NIST Atomic Spectra Database (ver. 5.10), Available: https://physics.nist.gov/asd [2022, November 14] (Gaithersburg, MD: National Institute of Standards and Technology) [Google Scholar]
- Křivková, A., Petera, L., Laitl, V., et al. 2021, Exp. Astron., 51, 425 [CrossRef] [Google Scholar]
- Mason, B. 1963, Space Sci. Rev., 1, 621 [NASA ADS] [CrossRef] [Google Scholar]
- Milley, E. P., Hawkes, R. L., & Ehrman, J. M. 2007, MNRAS, 382, L67 [NASA ADS] [CrossRef] [Google Scholar]
- Popova, O., Borovička, J., Hartmann, W. K., et al. 2011, Meteorit. Planet. Sci., 46, 1525 [NASA ADS] [CrossRef] [Google Scholar]
- Popova, O. P., Jenniskens, P., Emel’yanenko, V., et al. 2013, Science, 342, 1069 [NASA ADS] [CrossRef] [Google Scholar]
- Popov, A. M., Akhmetzhanov, T. F., Labutin, T. A., et al. 2016, Spectrochim. Acta Part B: Atomic Spectrosc., 125, 43 [NASA ADS] [CrossRef] [Google Scholar]
- Popov, A. M., Berezhnoy, A. A., Borovička, J., et al. 2021, MNRAS, 500, 4296 [Google Scholar]
- Sakellaris, C. N., Miliordos, E., & Mavridis, A. 2011, J. Chem. Phys., 134, 234308 [NASA ADS] [CrossRef] [Google Scholar]
- Shabanov, S. V., & Gornushkin, I. B. 2014, Spectrochim. Acta Part B: Atomic Spectrosc., 100, 147 [NASA ADS] [CrossRef] [Google Scholar]
- Silber, E. A., Boslough, M., Hocking, W. K., Gritsevich, M., & Whitaker, R. W. 2018, AdSpR, 62, 489 [NASA ADS] [Google Scholar]
- West, J. B., & Broida, H. 1975, J. Chem. Phys., 62, 2566 [NASA ADS] [CrossRef] [Google Scholar]
- Zakuskin, A. S., Popov, A. M., & Labutin, T. A. 2019, J. Anal. Atomic Spectr., 34, 1975 [CrossRef] [Google Scholar]
- Zakuskin, A., Beglaryan, B., & Labutin, T. A. 2021, in 2021 International Symposium on Molecular Spectroscopy, Talk FL09 [Google Scholar]
- Zaytsev, S. M., Popov, A. M., & Labutin, T. A. 2019, Spectrochim. Acta Part B: Atomic Spectrosc., 158 [Google Scholar]
Appendix A: Plasma temperature estimation
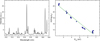 |
Fig. A.1. LIP spectrum of Fe3O4 sample (left) at 100 Torr pressure and 15 μs delay with the Fe I lines used for the temperature estimation and the Boltzmann plot (right) constructed on these atomic lines. The green line is a linear approximation resulting in a temperature of 5200 ± 200 K. |
Appendix B: Spectral shape comparison
Delay variations change the relative intensities of the Fe atomic lines and the FeO bands to a greater extent than variations in pressure within the considered range from 75 to 150 Torr. The detailed visual comparison shows that although the 100 Torr, 12 μs and the 100 Torr, 15 μs spectra are closest to the Benešov spectrum, the spectrum at 15 μs exhibits more peculiarities and local features within the FeO band region, which makes it most similar to the bolide spectrum.
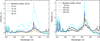 |
Fig. B.1. Comparison of LIP spectra with the spectrum of the Benešov bolide at an altitude of 39 km. LIP spectra are grouped for a constant pressure of 100 Torr (left) and for a constant delay of 15 μs (right). |
All Tables
All Figures
|
Fig. 1. Spectra of the Benešov bolide wake at 39 km (black) and LIP at 3.75 Torr (red), which corresponds to an altitude of 39 km: Overview in the spectral range of 555–614 nm (left), and detailed view of the FeO orange band region (right). |
| In the text | |
|
Fig. 2. Criterion of spectrum similarity in the space of two ratios of the atomic line to the molecular band. Left: all investigated points in the pressure range 75–200 Torr and delay range 7–20 μs. Right: experimental points providing the highest similarity between the laboratory and meteor spectra. |
| In the text | |
|
Fig. 3. LIP spectrum (100 Torr, 15 μs) with the highest degree of similarity with the spectrum of the wake of the Benešov bolide at 39 km. |
| In the text | |
|
Fig. A.1. LIP spectrum of Fe3O4 sample (left) at 100 Torr pressure and 15 μs delay with the Fe I lines used for the temperature estimation and the Boltzmann plot (right) constructed on these atomic lines. The green line is a linear approximation resulting in a temperature of 5200 ± 200 K. |
| In the text | |
|
Fig. B.1. Comparison of LIP spectra with the spectrum of the Benešov bolide at an altitude of 39 km. LIP spectra are grouped for a constant pressure of 100 Torr (left) and for a constant delay of 15 μs (right). |
| In the text | |
Current usage metrics show cumulative count of Article Views (full-text article views including HTML views, PDF and ePub downloads, according to the available data) and Abstracts Views on Vision4Press platform.
Data correspond to usage on the plateform after 2015. The current usage metrics is available 48-96 hours after online publication and is updated daily on week days.
Initial download of the metrics may take a while.