Open Access
Fig. A.1.
Download original image
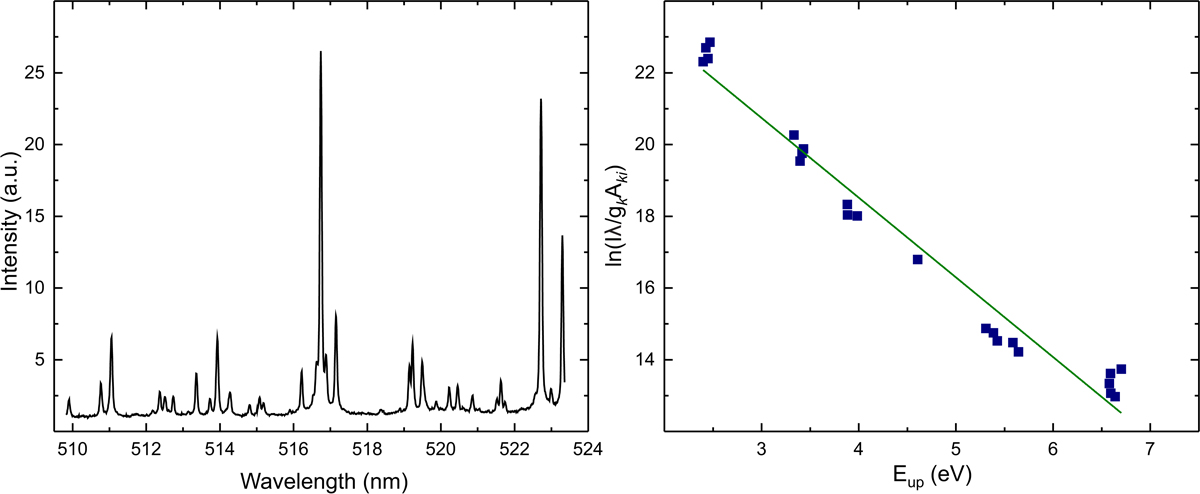
LIP spectrum of Fe3O4 sample (left) at 100 Torr pressure and 15 μs delay with the Fe I lines used for the temperature estimation and the Boltzmann plot (right) constructed on these atomic lines. The green line is a linear approximation resulting in a temperature of 5200 ± 200 K.
Current usage metrics show cumulative count of Article Views (full-text article views including HTML views, PDF and ePub downloads, according to the available data) and Abstracts Views on Vision4Press platform.
Data correspond to usage on the plateform after 2015. The current usage metrics is available 48-96 hours after online publication and is updated daily on week days.
Initial download of the metrics may take a while.