Fig. 2.
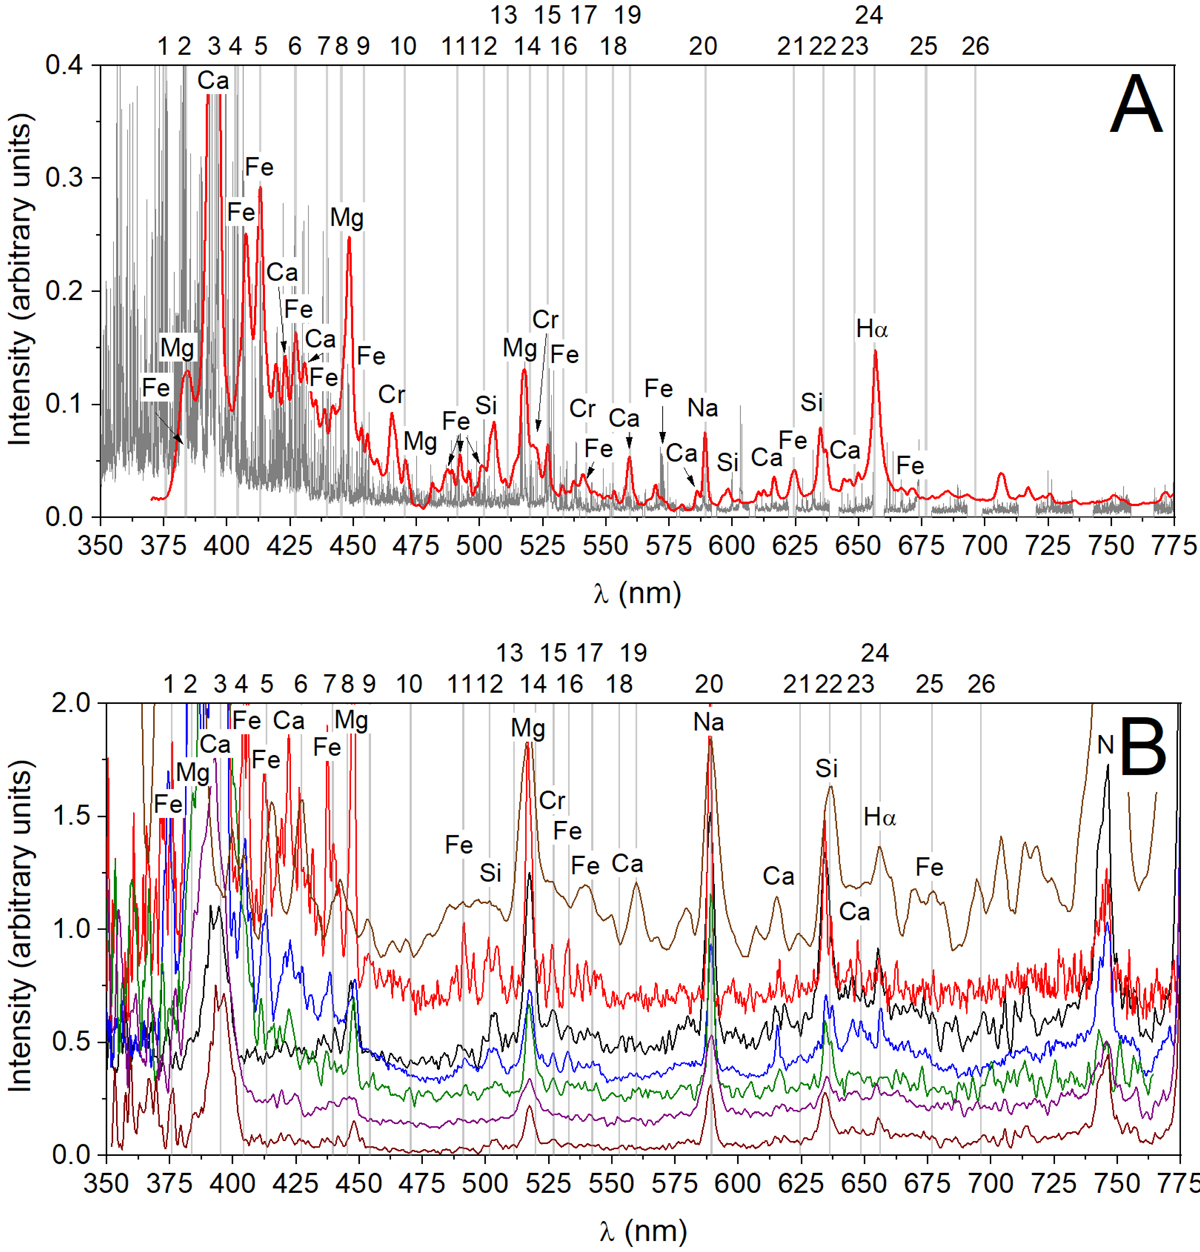
Panel A: high-resolution (gray) together with the low-resolution (red) spectrum. The most significant spectral lines are labeled. Panel B: examples of spectra recorded by observational spectographs. Starting with the upper spectrum of Perseid 20150811_014658 (brown), Sporadic 20161227_020734 (red), Perseid 20150812_231001 (black), Leonide 20161117_042009 (blue), Ursae Majorid 20161213_014212 (green), Alpha Camelopardalid 20161002_013415 (purple), and Perseid 20150812_232102 (wine). Overview of the selected spectral features (marked with gray lines). The detailed description of the individual spectral lines is provided in Table A.1.
Current usage metrics show cumulative count of Article Views (full-text article views including HTML views, PDF and ePub downloads, according to the available data) and Abstracts Views on Vision4Press platform.
Data correspond to usage on the plateform after 2015. The current usage metrics is available 48-96 hours after online publication and is updated daily on week days.
Initial download of the metrics may take a while.