Fig. 8.
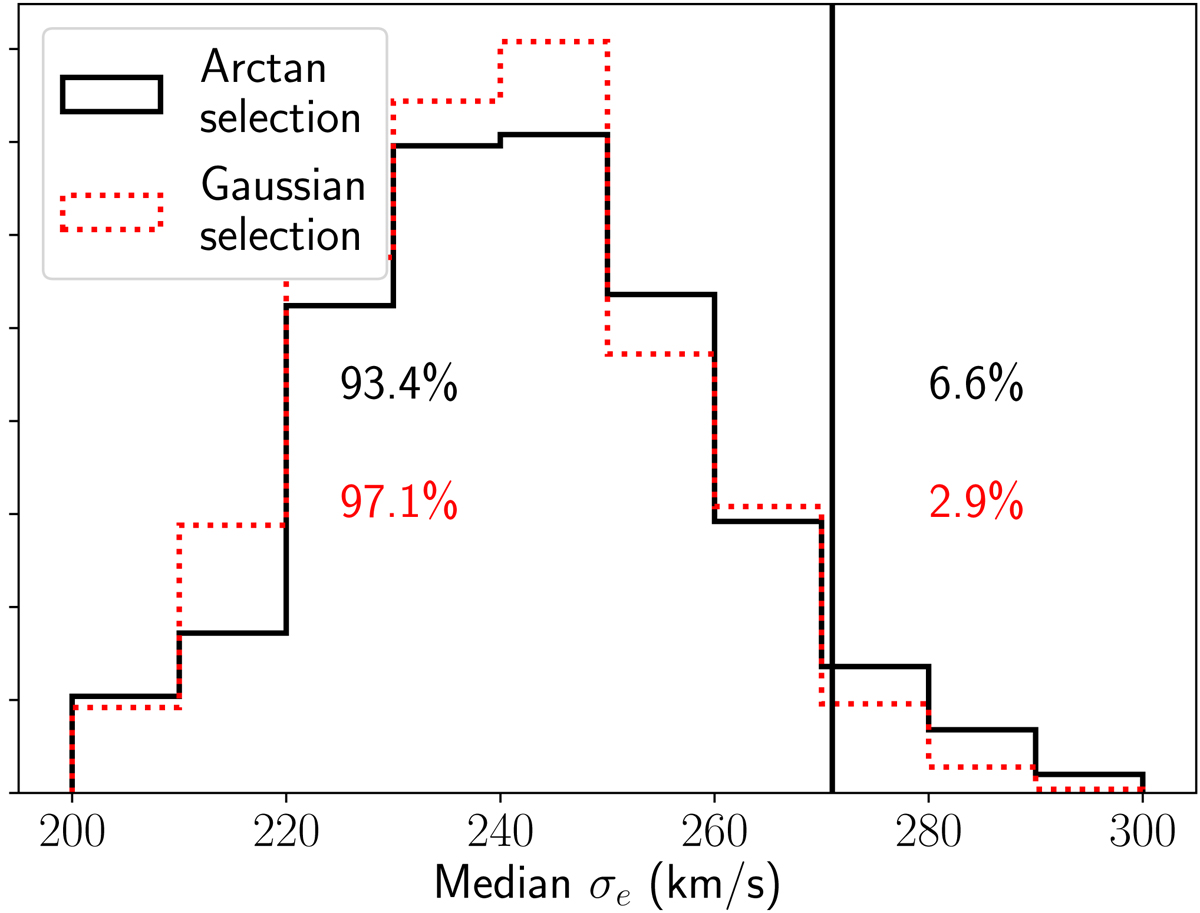
Posterior predictive distribution in the median value of the central stellar velocity dispersion σe, from mock realisations of sets of 23 SuGOHI lenses, generated from the posterior probability distribution inferred for the “Arctan” (black solid) and “Gaussian” (red dotted) models. The vertical line marks the median value of the stellar velocity dispersion of the lenses in our sample, as measured by BOSS. The percentages left and right of the vertical line indicate the fraction of mock realisations with a median σe smaller or larger than the observed value, for the two models.
Current usage metrics show cumulative count of Article Views (full-text article views including HTML views, PDF and ePub downloads, according to the available data) and Abstracts Views on Vision4Press platform.
Data correspond to usage on the plateform after 2015. The current usage metrics is available 48-96 hours after online publication and is updated daily on week days.
Initial download of the metrics may take a while.