Fig. 7.
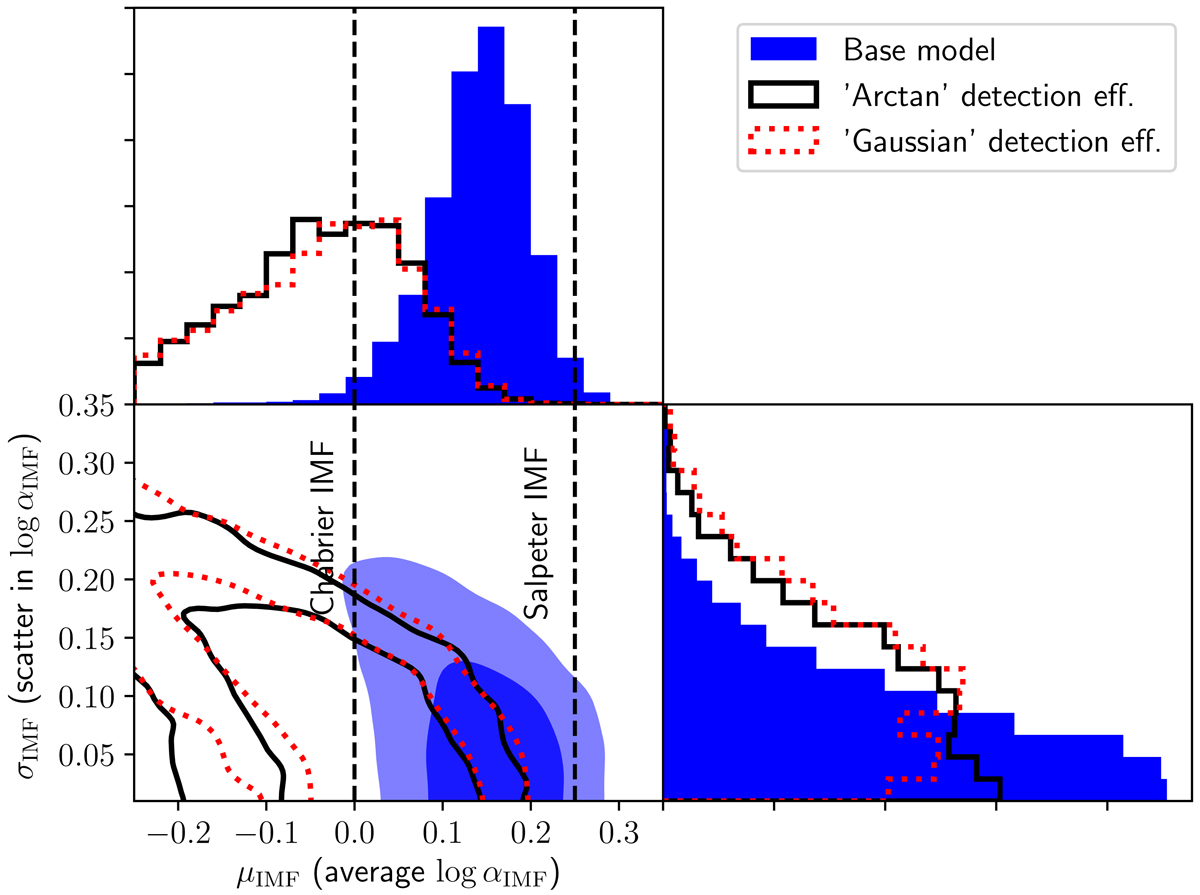
Posterior probability distribution of the hyper-parameters describing the IMF normalisation of the CMASS sample, marginalised over the other hyper-parameters. Filled contours: base model. Black solid lines: model with “Arctan” detection efficiency function. Red dotted lines: model with “Gaussian” detection efficiency function. Contour levels mark the 68% and 95% enclosed probability regions. The vertical dashed lines correspond to an average IMF normalisation equal to that of a Chabrier and Salpeter IMF, respectively.
Current usage metrics show cumulative count of Article Views (full-text article views including HTML views, PDF and ePub downloads, according to the available data) and Abstracts Views on Vision4Press platform.
Data correspond to usage on the plateform after 2015. The current usage metrics is available 48-96 hours after online publication and is updated daily on week days.
Initial download of the metrics may take a while.