Fig. 6.
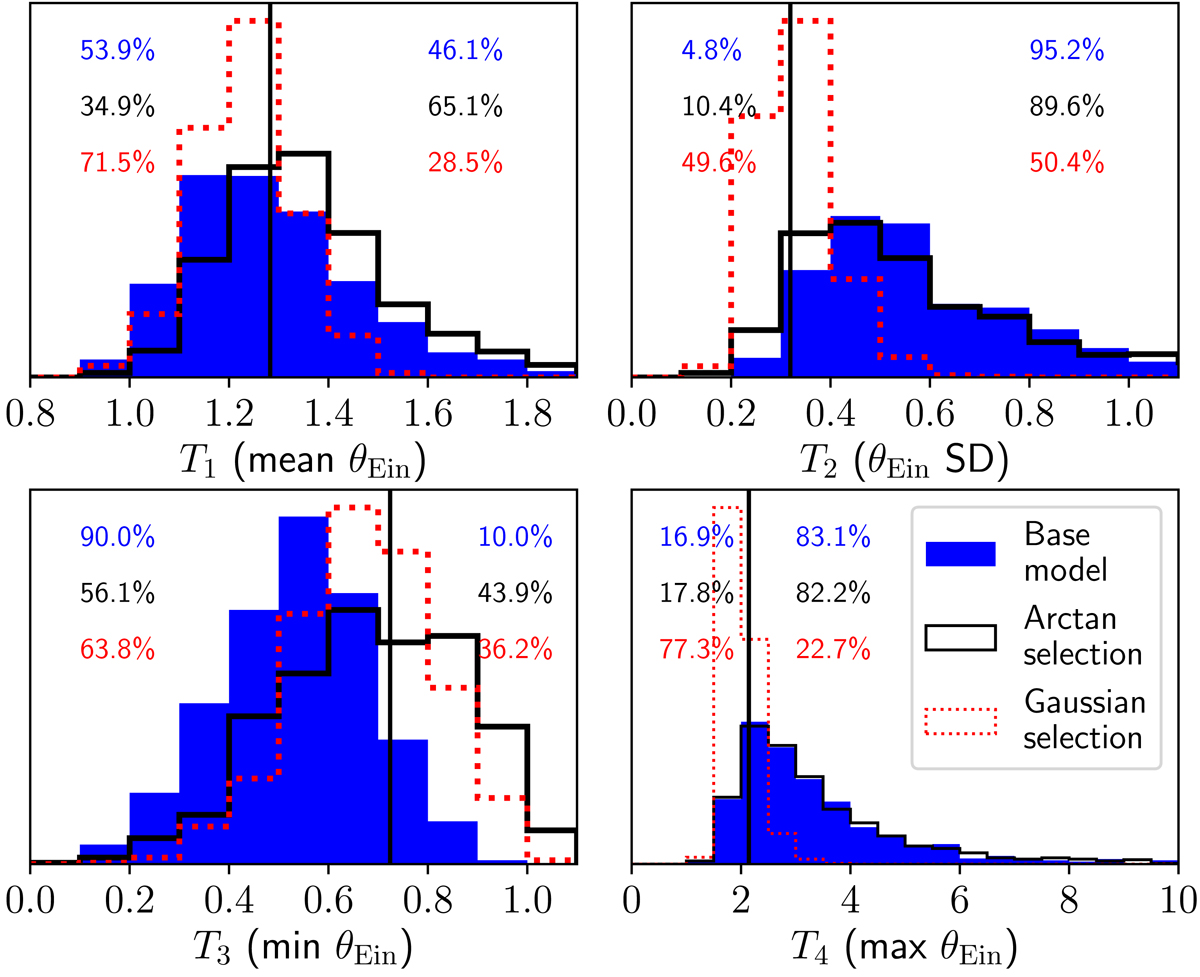
Posterior predictive tests. Four panels: predicted distributions in the average, standard deviation, minimum, and maximum θEin (in arcseconds) in samples of 23 strong lens systems drawn from the posterior. The vertical line in each panel corresponds to the observed value of each test quantity. Posterior predicted distributions obtained from the base model are shown as filled histograms in blue. The black solid line and red dotted line histograms correspond to the “Arctan” and “Gaussian” lens detection efficiency models introduced in Sect. 5. The percentage to the left (right) side of each panel indicates the fraction of times the predicted value is smaller (larger) than the observed one, with the top value corresponding to the base model and the middle and bottom values corresponding to the “Arctan” and “Gaussian” models, respectively.
Current usage metrics show cumulative count of Article Views (full-text article views including HTML views, PDF and ePub downloads, according to the available data) and Abstracts Views on Vision4Press platform.
Data correspond to usage on the plateform after 2015. The current usage metrics is available 48-96 hours after online publication and is updated daily on week days.
Initial download of the metrics may take a while.