Free Access
Fig. 3.
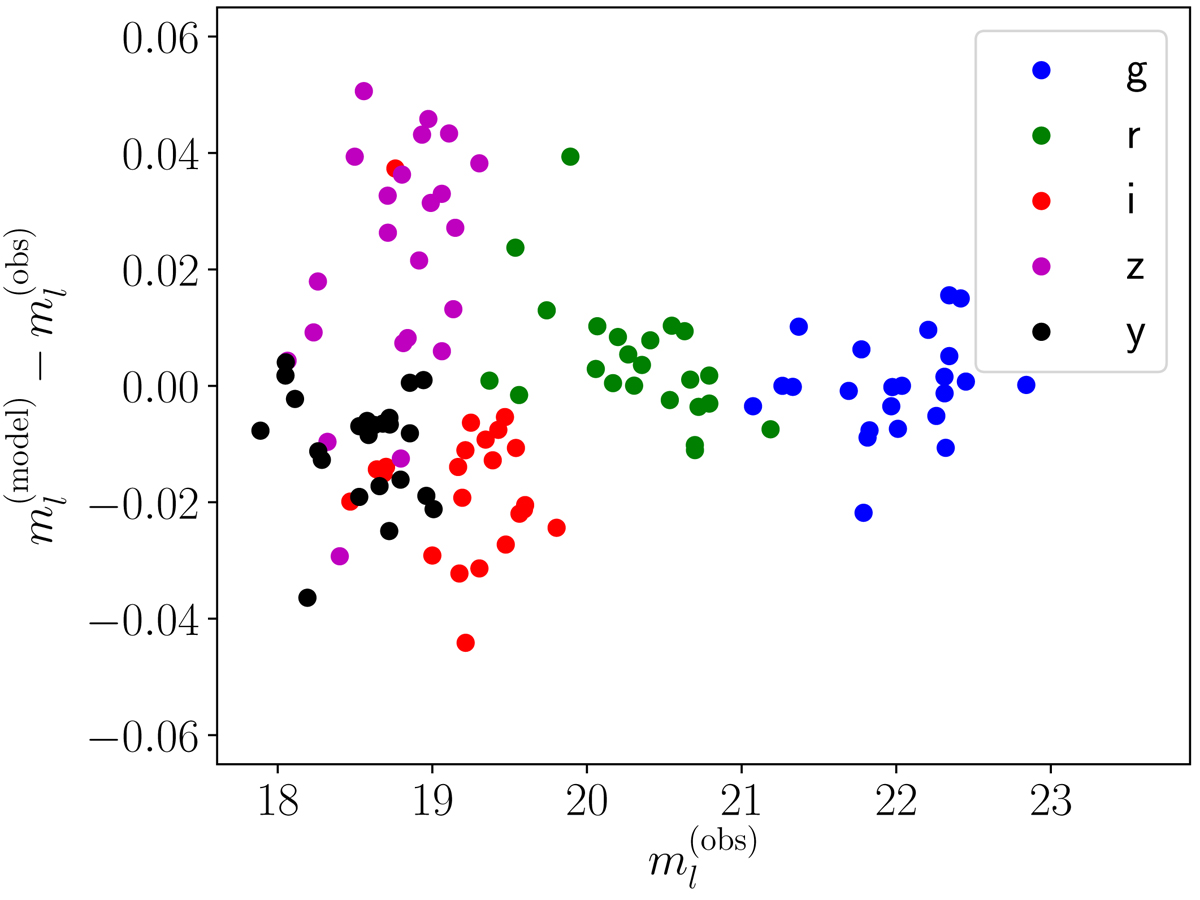
Difference between magnitudes predicted by the CSP model that maximises the likelihood and the observed magnitudes, as a function of the latter. Different colours correspond to different HSC filters. The typical observational uncertainty on the observed magnitudes, from Sérsic profile fitting, is 0.02.
Current usage metrics show cumulative count of Article Views (full-text article views including HTML views, PDF and ePub downloads, according to the available data) and Abstracts Views on Vision4Press platform.
Data correspond to usage on the plateform after 2015. The current usage metrics is available 48-96 hours after online publication and is updated daily on week days.
Initial download of the metrics may take a while.