Fig. B.2
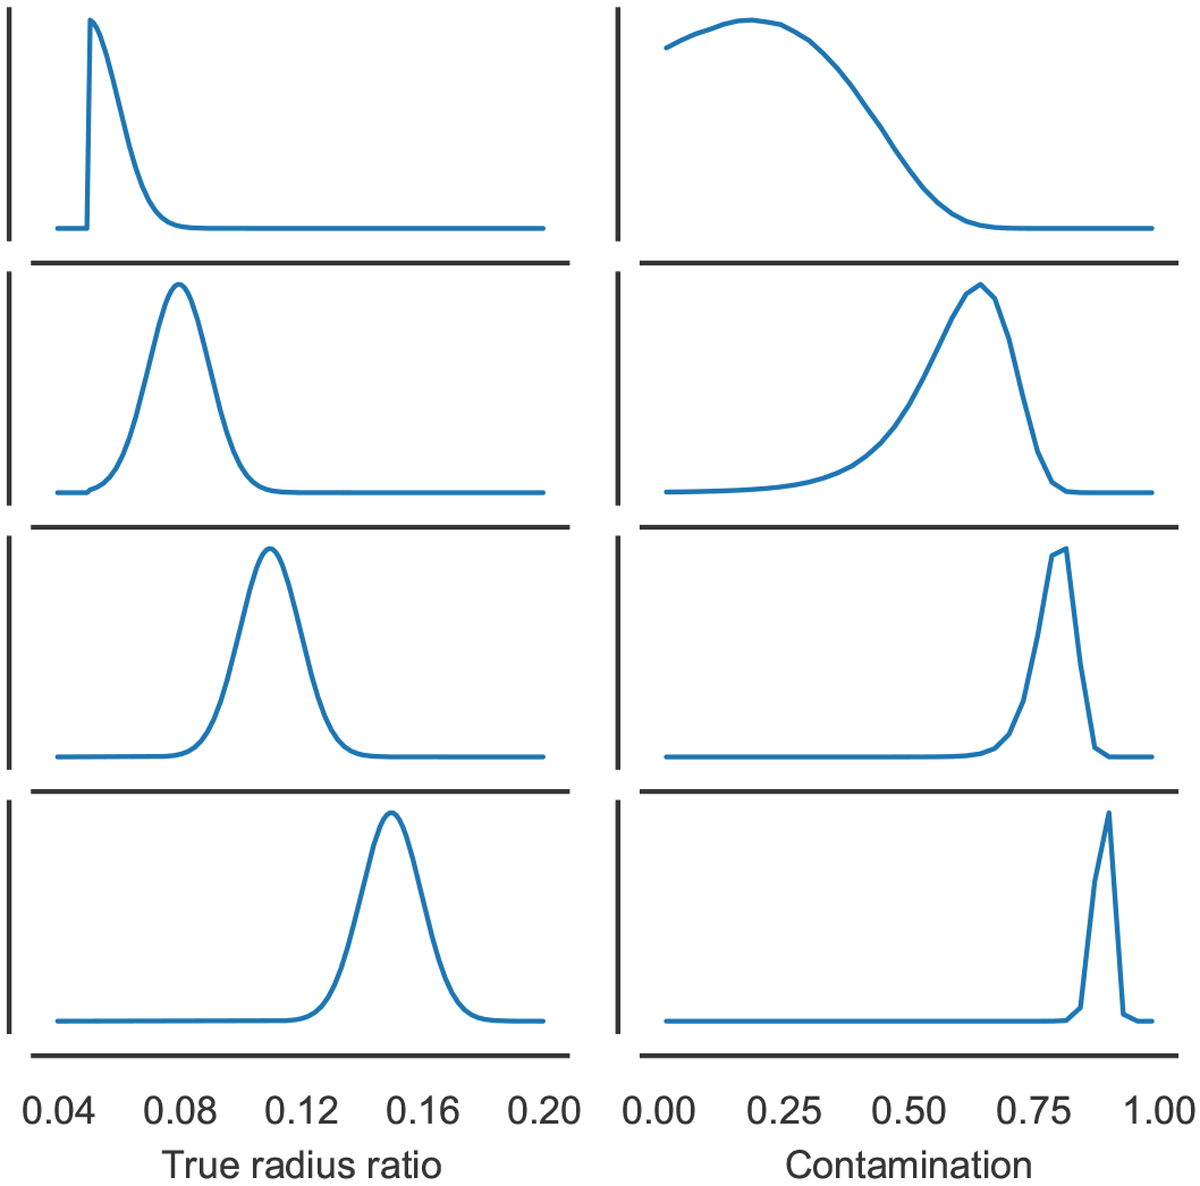
Effect of changing mode of ktrue posterior on the contamination posterior distribution. Apparent radius ratio is again assumed constant, kapp =0.04, and the ktrue posterior ismodelled as concatenated normal distribution with a lower limit of 0.04. Right panels: contamination distribution corresponding to the true radius ratio distribution on the left panel.
Current usage metrics show cumulative count of Article Views (full-text article views including HTML views, PDF and ePub downloads, according to the available data) and Abstracts Views on Vision4Press platform.
Data correspond to usage on the plateform after 2015. The current usage metrics is available 48-96 hours after online publication and is updated daily on week days.
Initial download of the metrics may take a while.