Free Access
Fig. 11
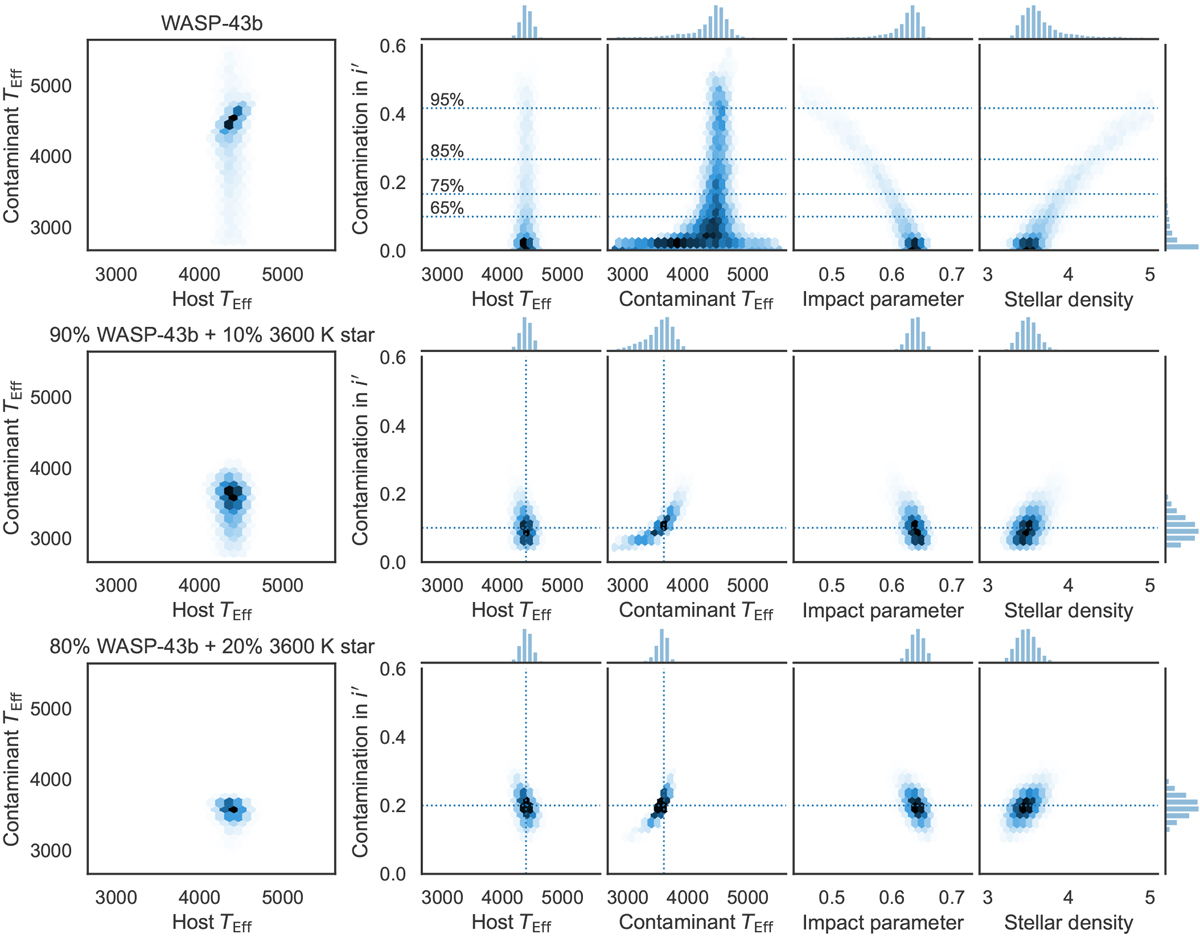
WASP-43b blending analysis using the MuSCAT2-observed light curves without injected contamination (above), with 10% contamination from a 3600 K star (middle), and with 20% contamination from a 3600 K star (bottom). The dotted lines show the 65, 75, 85, and 95% percentiles for the posterior contamination.
Current usage metrics show cumulative count of Article Views (full-text article views including HTML views, PDF and ePub downloads, according to the available data) and Abstracts Views on Vision4Press platform.
Data correspond to usage on the plateform after 2015. The current usage metrics is available 48-96 hours after online publication and is updated daily on week days.
Initial download of the metrics may take a while.