Fig. 4.
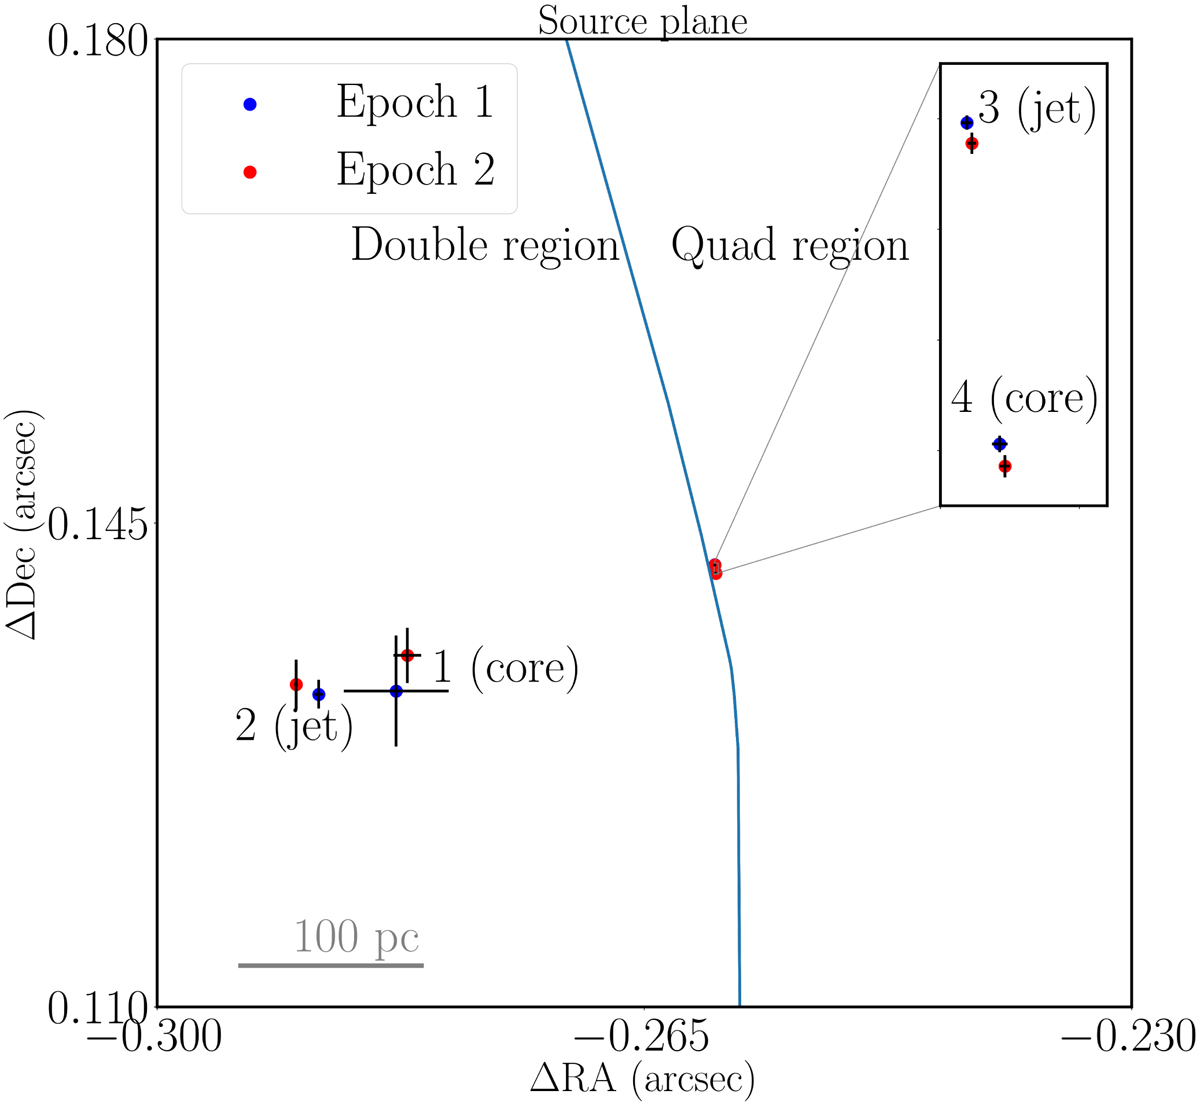
Source-plane model for the VLBA observations of MG B2016+112. Epoch 1 (blue) and 2 (red) observations aligned on the lensing galaxy position, which is at (0, 0). The solid blue line represents the caustics, which divides the source-plane into the double- and quadruple-image regions. The position of the sources is indicated by the filled circles. Source 1 corresponds to images A2–B2, source 2 corresponds to images A1–B1, source 3 corresponds to images C11–C21, and source 4 corresponds to images C12–C22. The labels “core” and “jet” are based on the radio spectral energy distribution of each image pair, as reported by More et al. (2009). The grey scale bar at the bottom left corner represents 100 pc at redshift z = 3.2773. The error bars take into account the uncertainties in the lens model. In the case of sources 1 and 2 (related to the lensed images A and B), the error is dominated by our ability to de-convolve the different source components, while for sources 3 and 4 (related to the lensed region C), the errors are very small because the sub-components are clearly spatially resolved due to their extremely large magnification (μ ∼ 270 to 350).
Current usage metrics show cumulative count of Article Views (full-text article views including HTML views, PDF and ePub downloads, according to the available data) and Abstracts Views on Vision4Press platform.
Data correspond to usage on the plateform after 2015. The current usage metrics is available 48-96 hours after online publication and is updated daily on week days.
Initial download of the metrics may take a while.