Fig. 1.
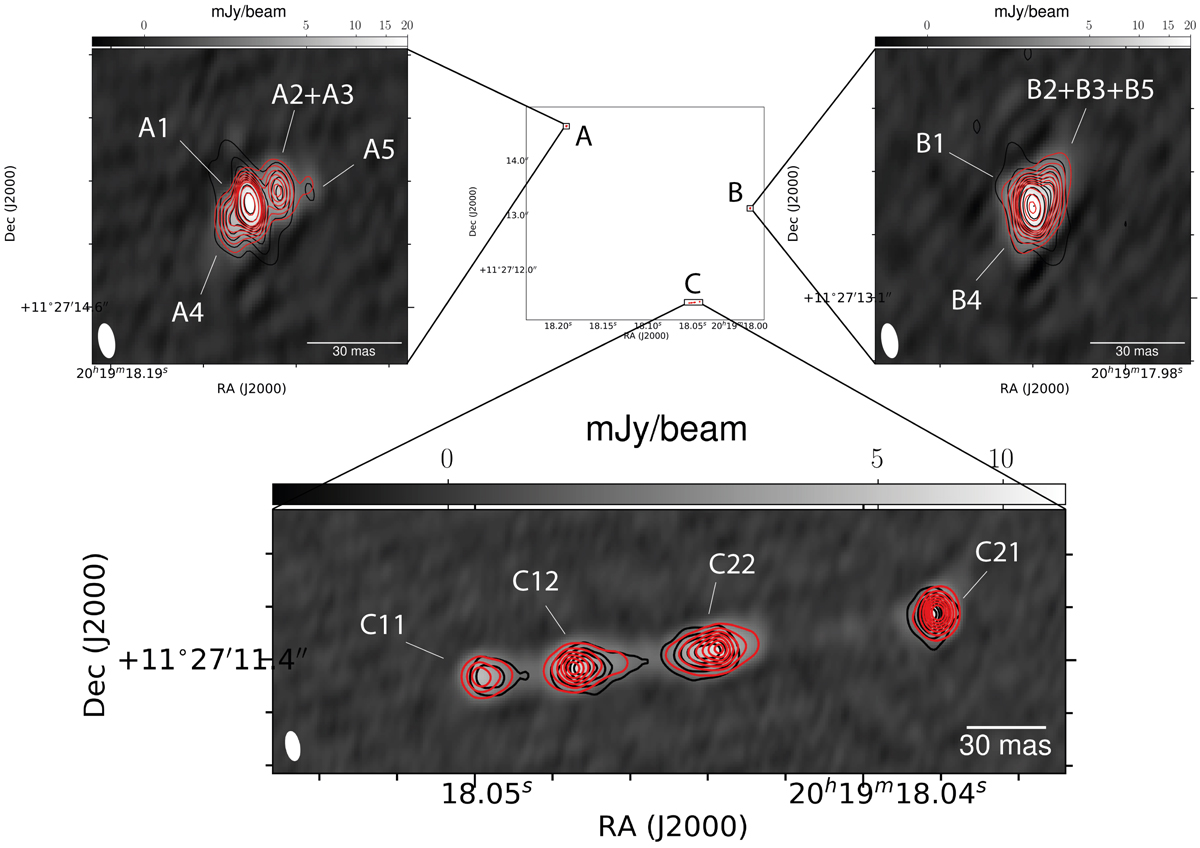
Multi-epoch VLBA observations at 1.7 GHz of the gravitational lens MG B2016+112. The central image shows the entire system as observed at 1.7 GHz with VLBI. The black contours are the observations taken on 2002 February 25 (Epoch 1), the greyscale map and the red contours are the new observations taken on 2016 July 2 (Epoch 2). The greyscale map is in units of mJy beam−1, as indicated by the colour bar in each image. On VLBI-scales, image A is resolved into four components (A1, A2+A3, A4 and A5 following the nomenclature of More et al. 2009), image B is resolved into two components (B1 and B2+B3+B5) with an indication for a possible third component (B4), while image C is resolved into four components (C11, C12, C22 and C21). The shift is more visible in region C, which is at higher magnification (μ ∼ 270 to 350). Contours are at (0.05, 0.1, 0.15, 0.2, 0.25, 0.3, 0.35, 0.5, 0.75, 1) × the peak flux density of each individual image, which is ∼22 mJy beam−1 for Epoch 1 and 23 mJy beam−1 for Epoch 2. The restoring beam is shown in the bottom left corner and is 11 mas × 5 mas at a position angle of 10°. All of the images are obtained using a Briggs weighting scheme, with Robust = 0.
Current usage metrics show cumulative count of Article Views (full-text article views including HTML views, PDF and ePub downloads, according to the available data) and Abstracts Views on Vision4Press platform.
Data correspond to usage on the plateform after 2015. The current usage metrics is available 48-96 hours after online publication and is updated daily on week days.
Initial download of the metrics may take a while.