Fig. A.1
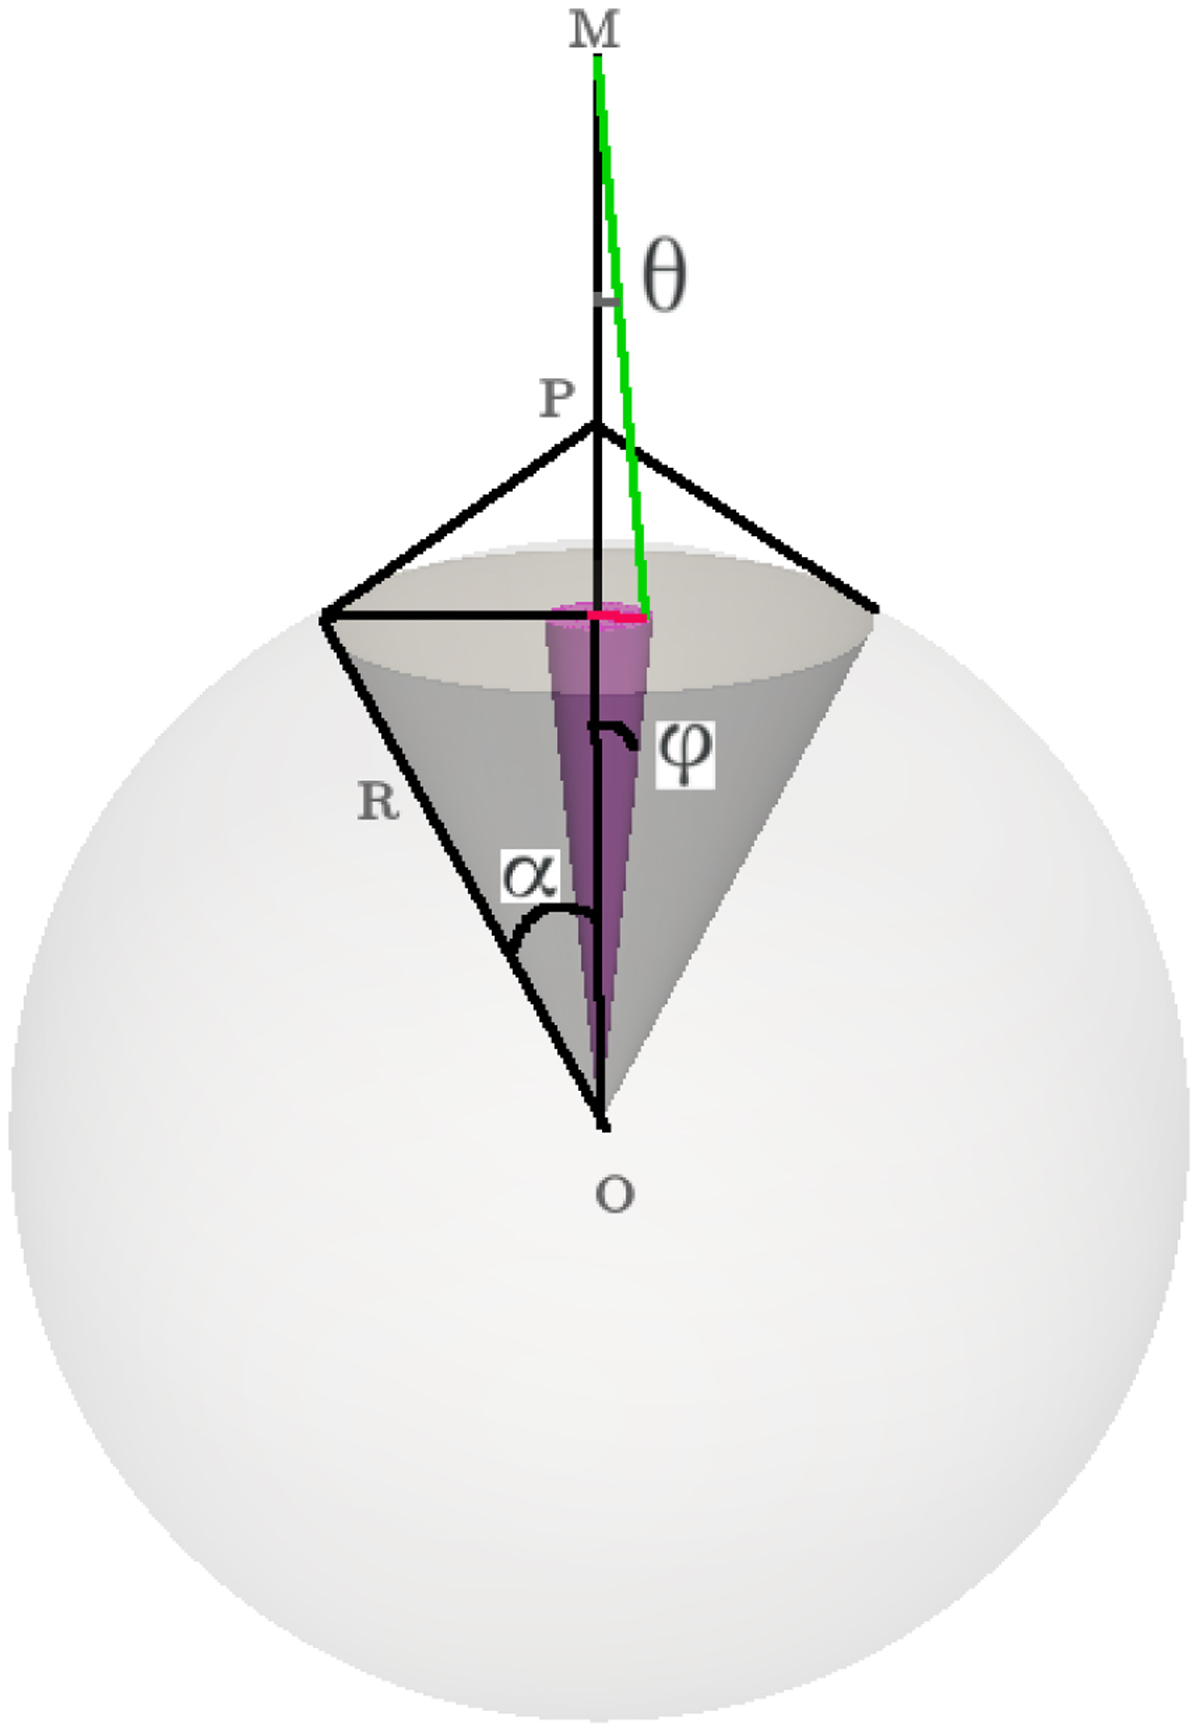
MIRO instrument positioned at point M with a FOV with half width at half maximum angle, θ. The gray cone is the portion of the spherical nucleus formed from the limits of visibility from point P. The magenta cone is the segment due to the projected MIRO FOV. The distances and angles in this graphic are not to scale. The ratio of solid angles that these cones subtend is given in Eq. (A.2).
Current usage metrics show cumulative count of Article Views (full-text article views including HTML views, PDF and ePub downloads, according to the available data) and Abstracts Views on Vision4Press platform.
Data correspond to usage on the plateform after 2015. The current usage metrics is available 48-96 hours after online publication and is updated daily on week days.
Initial download of the metrics may take a while.