Fig. 4
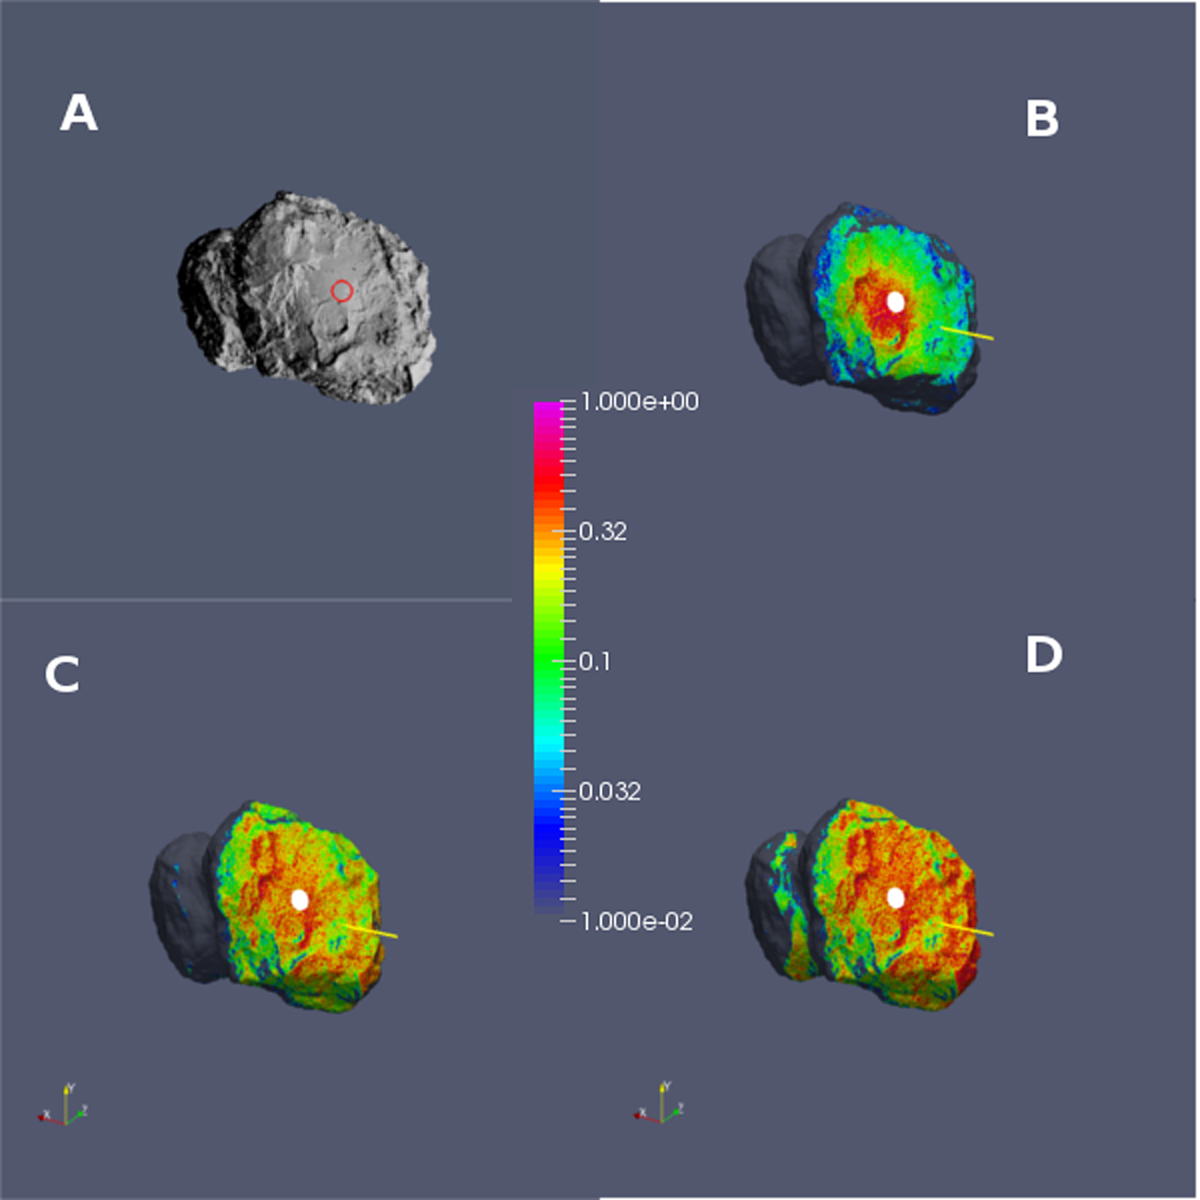
Case 1: illumination conditions for a given time stamp (panel A). Panels B–D: surface distributions of H2O density originating from different facets into the MIRO LOS at selected grid points 2.5, 5, and 20 km from the surface. The red circle in (A) and white dots in (B–D) indicate the footprint of MIRO’s sub-millimeter beam (see text for details).
Current usage metrics show cumulative count of Article Views (full-text article views including HTML views, PDF and ePub downloads, according to the available data) and Abstracts Views on Vision4Press platform.
Data correspond to usage on the plateform after 2015. The current usage metrics is available 48-96 hours after online publication and is updated daily on week days.
Initial download of the metrics may take a while.