Fig. 3
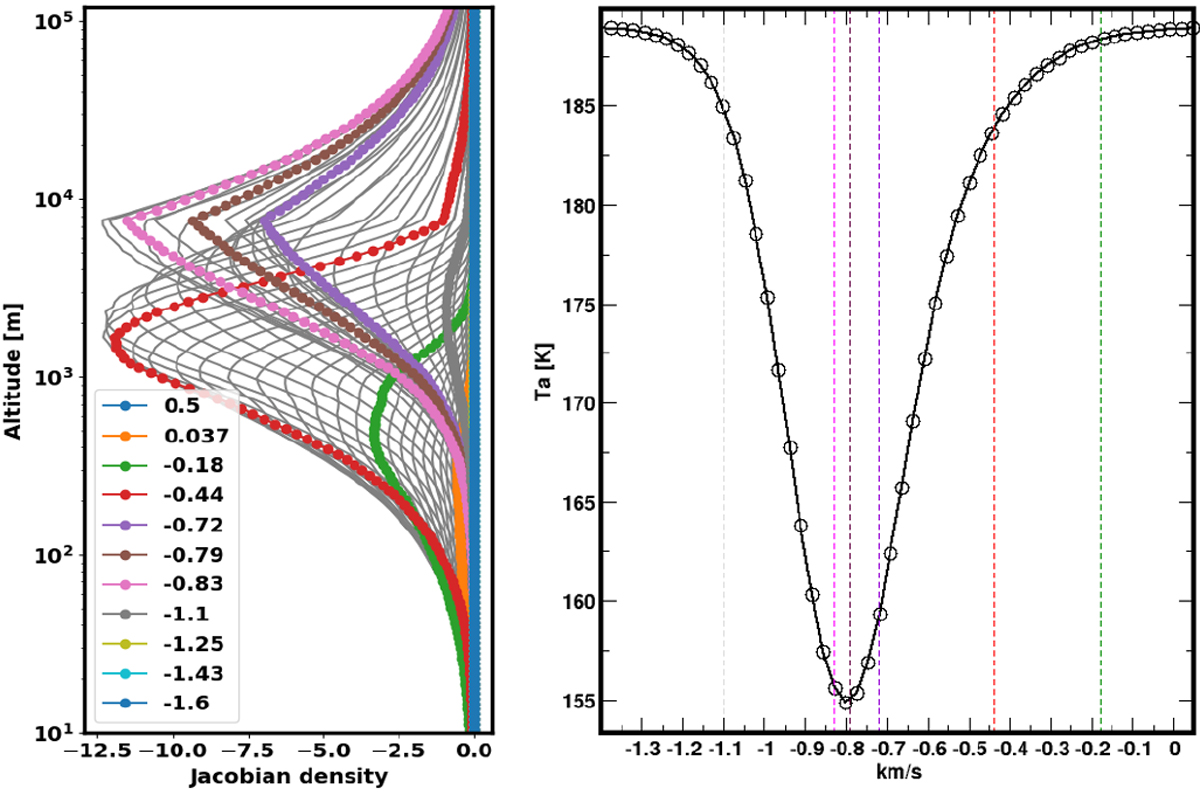
Left: Nadir Jacobians for the H![]() O MIRO transition at 547 GHz with respect to H2O density. Jacobians are ploted for all velocity points as gray lines, however, several functions are plotted in color for selected velocities. This way it is easier to see which Jacobians correspond to the line wing and/or line center. Right: simulated nadir H
O MIRO transition at 547 GHz with respect to H2O density. Jacobians are ploted for all velocity points as gray lines, however, several functions are plotted in color for selected velocities. This way it is easier to see which Jacobians correspond to the line wing and/or line center. Right: simulated nadir H![]() O spectra line overlaid with vertical dashed lines of different color at certain velocities. These have correspondence to the colors and velocities shown in the left panel. In this example, the spacecraft altitude is just above 100 km from the surface. Ta stands for antenna temperature.
O spectra line overlaid with vertical dashed lines of different color at certain velocities. These have correspondence to the colors and velocities shown in the left panel. In this example, the spacecraft altitude is just above 100 km from the surface. Ta stands for antenna temperature.
Current usage metrics show cumulative count of Article Views (full-text article views including HTML views, PDF and ePub downloads, according to the available data) and Abstracts Views on Vision4Press platform.
Data correspond to usage on the plateform after 2015. The current usage metrics is available 48-96 hours after online publication and is updated daily on week days.
Initial download of the metrics may take a while.