Fig. 5.
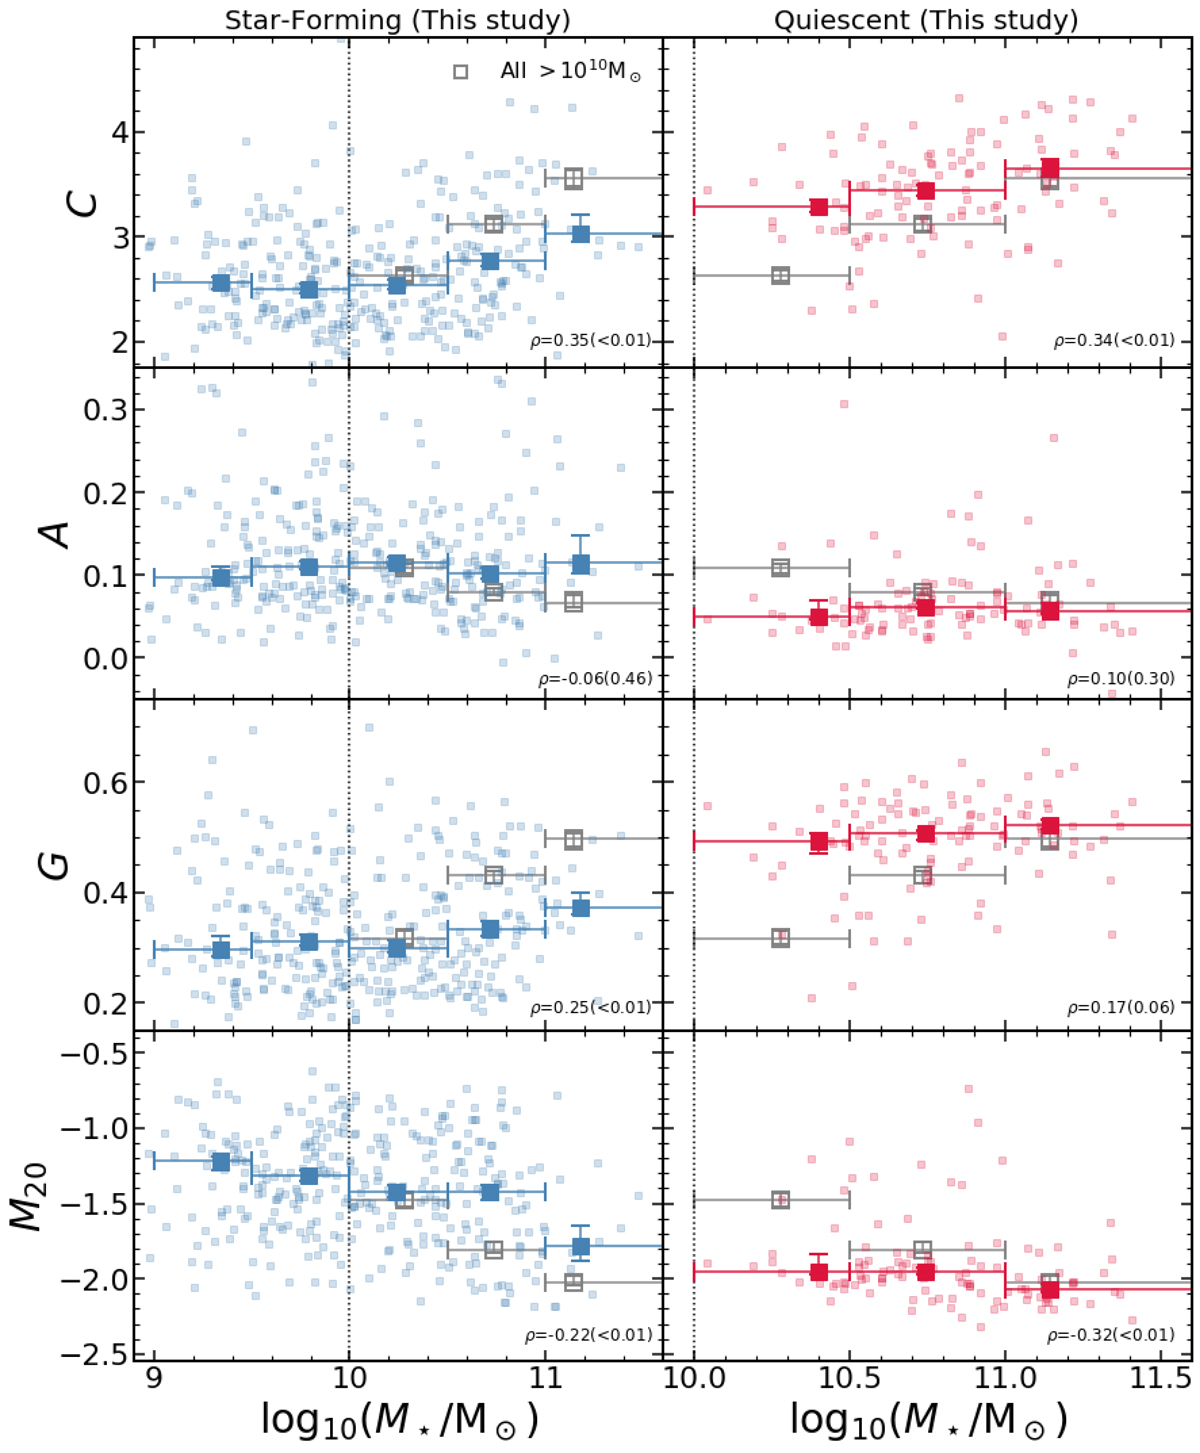
Light concentration (top), image asymmetry (middle top), Gini coefficient (middle bottom), and moment of light (bottom) as a function of stellar mass. We add to all panels the relation for the global sample at M⋆ > 1010 M⊙ as empty grey squares. In each panel, we show the Spearman correlation coefficient, ρ, and the corresponding probability of an uncorrelated dataset having the same distribution in parenthesis (considering only M⋆ > 1010 M⊙). We find quiescent galaxies to have a higher concentration of light than star-forming galaxies at similar stellar masses. We also find quiescent galaxies to have less disturbed profiles at stellar masses greater than 1010 M⊙. This is likely a reflection of the lack of star formation that is clumpier in nature (Conselice 2003). We also find quiescent galaxies to have their light concentrated on a smaller area (higher value of G) than star-forming galaxies at similar stellar masses. Finally, quiescent galaxies are smoother (lower values of M20) at all stellar masses, as also seen in the asymmetry parameter.
Current usage metrics show cumulative count of Article Views (full-text article views including HTML views, PDF and ePub downloads, according to the available data) and Abstracts Views on Vision4Press platform.
Data correspond to usage on the plateform after 2015. The current usage metrics is available 48-96 hours after online publication and is updated daily on week days.
Initial download of the metrics may take a while.