Fig. 4.
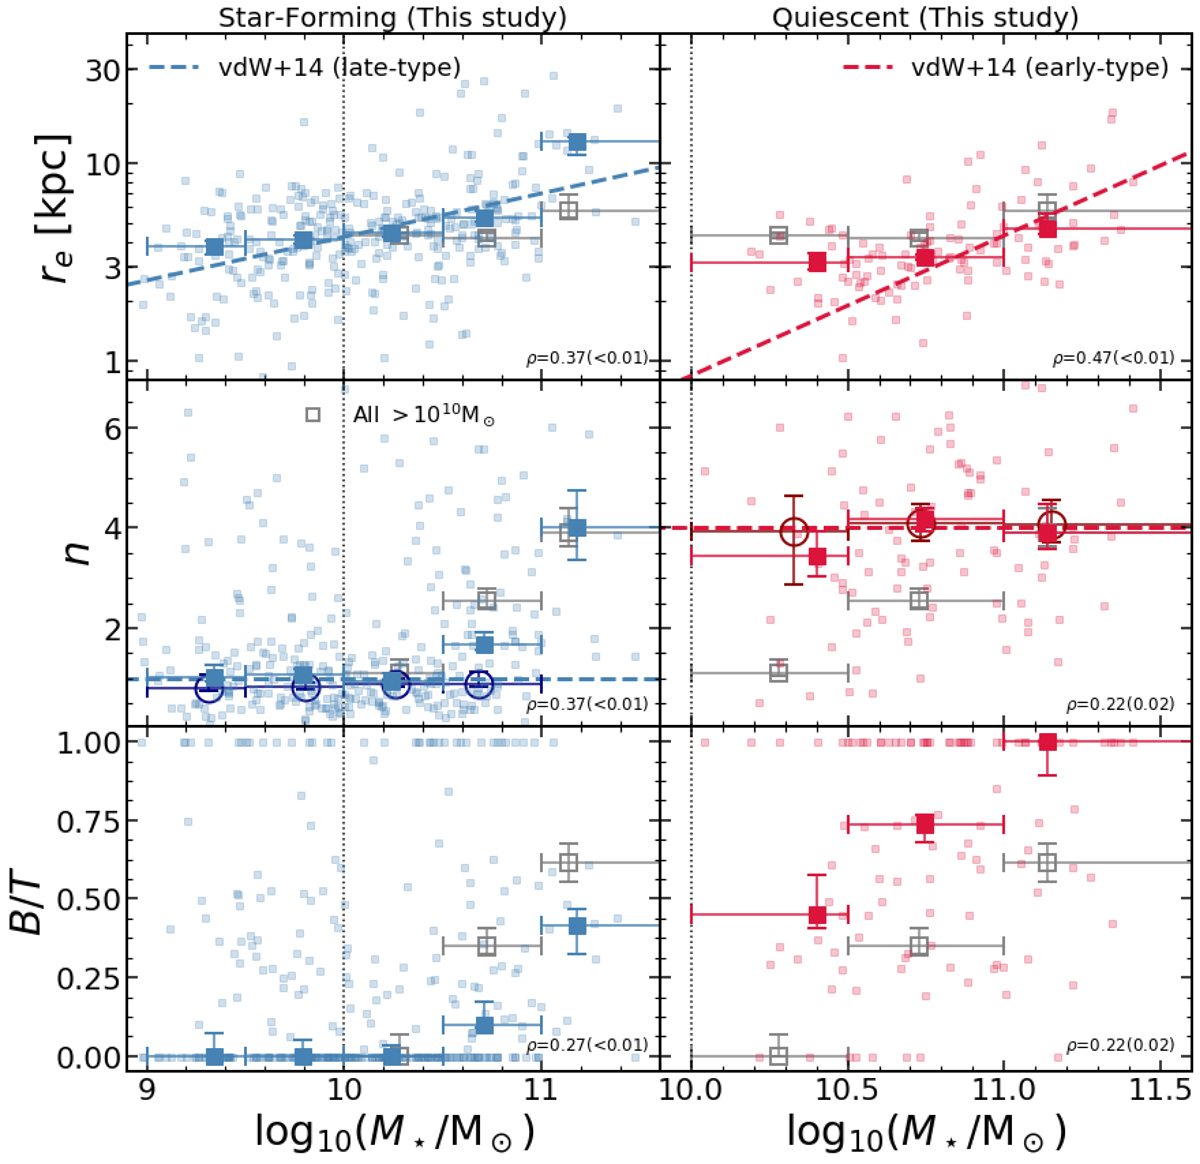
Top: stellar-mass size relation at z ∼ 0.84 for all galaxies in our sample, divided into star-forming (left) and quiescent (right) subsamples. We also show the derived relation for a large sample at similar redshift for star-forming (blue dashed line) and quiescent galaxies (red dotted line) derived by van der Wel et al. (2014). We find a good agreement between our sample and a magnitude-limited sample at these redshifts, indicating that our sample is representative of the larger population in terms of sizes and stellar masses. Middle: Sérsic index as a function of stellar mass for galaxies best fit by a single Sérsic profile. The median value for all galaxies is shown with large squares, and that for the subset of galaxies best fit with one component is shown with large empty circles. We show as horizontal dashed lines the values for an exponential disc (blue, n = 1) and a classical elliptical (red, n = 4) profile. The vertical dotted line highlights the stellar mass selection limit of our survey. We find star-forming and quiescent galaxies to align with the classical expectations at lower redshifts, with quiescent galaxies and star-forming galaxies having profiles typical of ellipticals and typical discs, respectively. Bottom: bulge-to-total light ratio as a function of stellar mass. The median is shown with large symbols. We find quiescent galaxies to have slightly more prominent bulges than star-forming galaxies at similar stellar masses. We add to all panels the relation for the global sample at M⋆ > 1010 M⊙ as empty grey squares. In each panel, we show the Spearman correlation coefficient, ρ, and the corresponding probability of an uncorrelated dataset having the same distribution in parentheses (considering only M⋆ > 1010 M⊙).
Current usage metrics show cumulative count of Article Views (full-text article views including HTML views, PDF and ePub downloads, according to the available data) and Abstracts Views on Vision4Press platform.
Data correspond to usage on the plateform after 2015. The current usage metrics is available 48-96 hours after online publication and is updated daily on week days.
Initial download of the metrics may take a while.