Fig. 1.
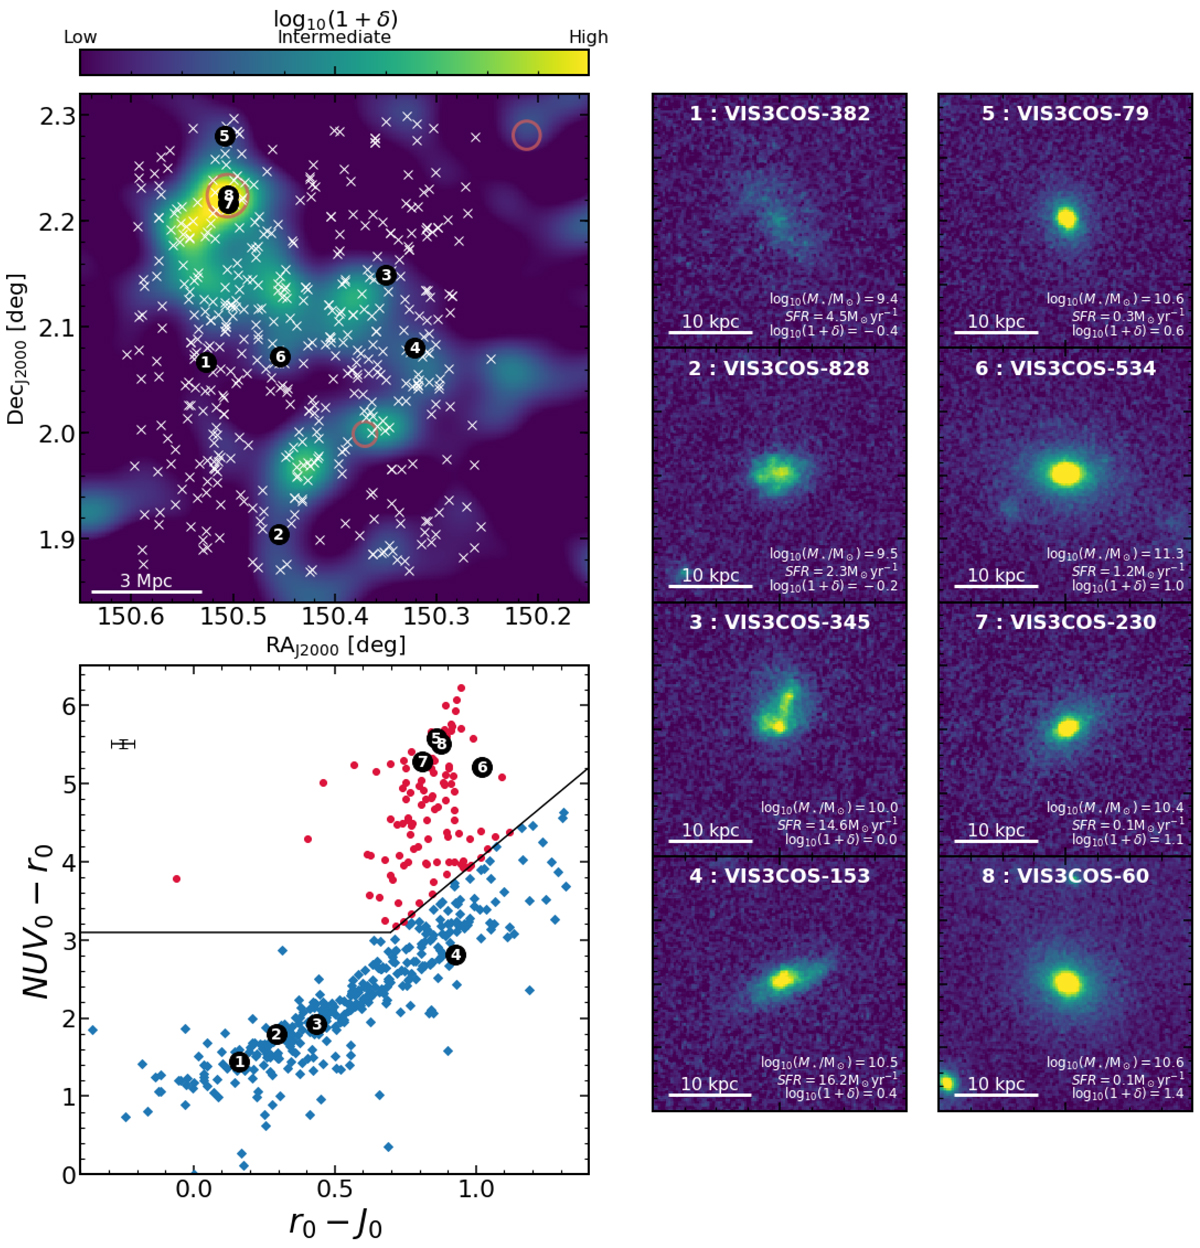
Top left: overview of the VIS3COS survey showing the galaxy overdensity and targeted galaxies at 0.8 < z < 0.9 with spectroscopic redshifts (white crosses) along with the location of known X-ray clusters (empty red circles, Finoguenov et al. 2007). Bottom left: NUV-r-J diagram (derived using Laigle et al. 2016 photometry) for galaxies in our survey, with the separation between quiescent (red circles) and star-forming (blue diamonds) as defined by Ilbert et al. (2013) shown as a solid line. We show the average error on each colour as a black cross. Right panels: examples of HST/ACS F814W 4″ × 4″ rest-frame B-band images (Koekemoer et al. 2007) of eight of our sources with individual information on stellar mass, SFR, and local overdensity in each panel. We highlight the position of these eight galaxies with large numbered black circles in the left panels.
Current usage metrics show cumulative count of Article Views (full-text article views including HTML views, PDF and ePub downloads, according to the available data) and Abstracts Views on Vision4Press platform.
Data correspond to usage on the plateform after 2015. The current usage metrics is available 48-96 hours after online publication and is updated daily on week days.
Initial download of the metrics may take a while.