Free Access
Fig. 6
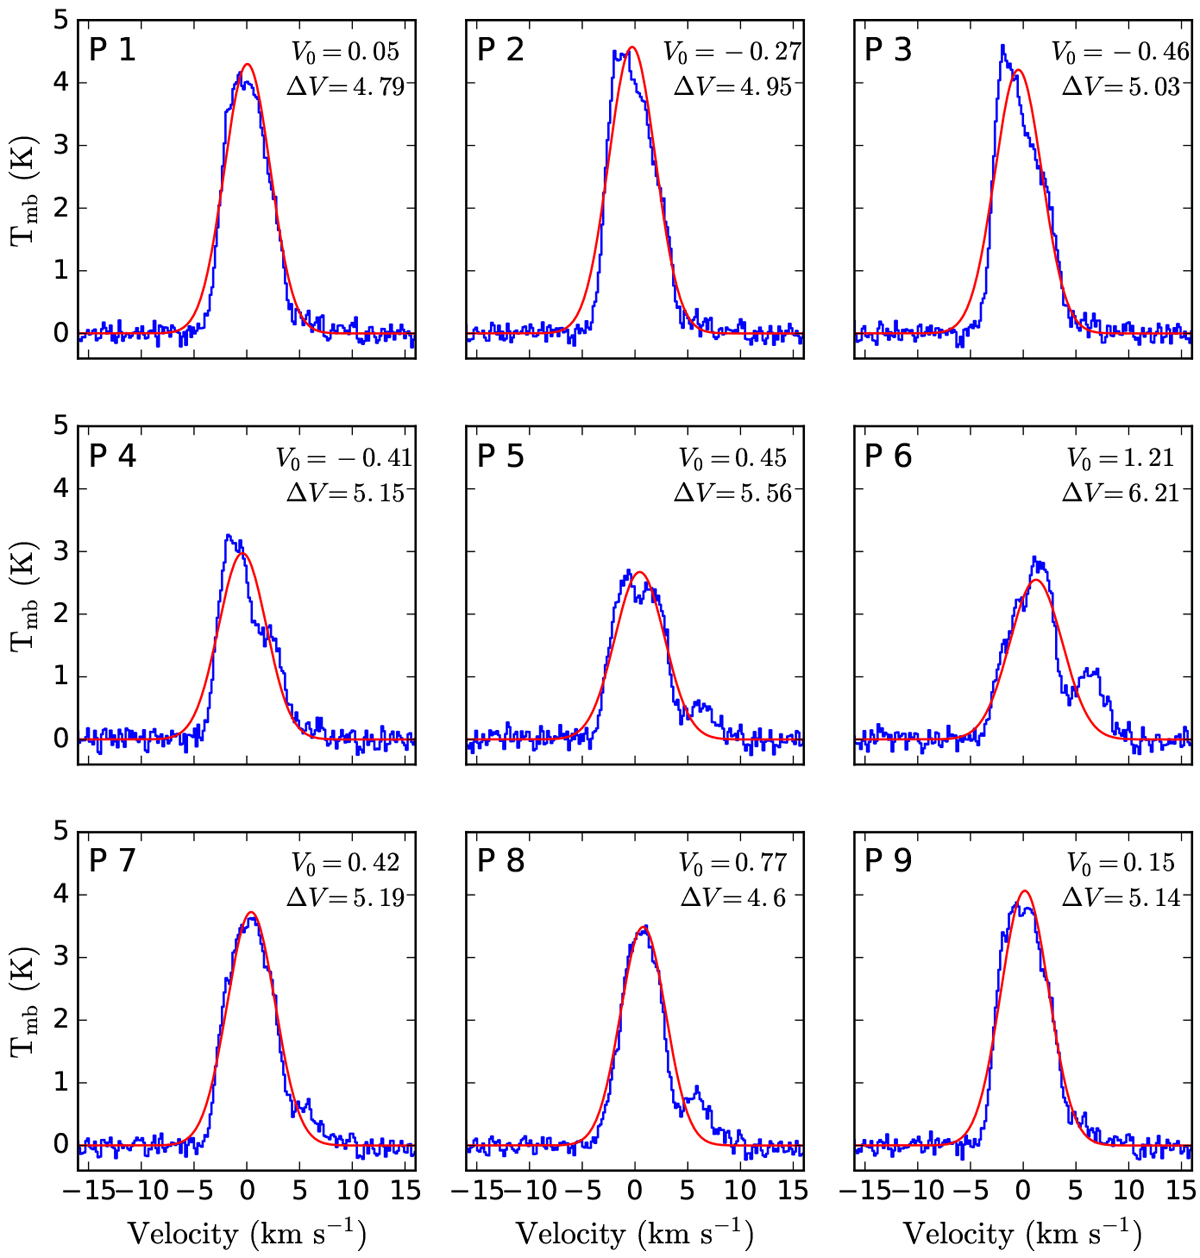
Extracted 13CO J = 1– 0 spectra from the PMO observations towards the KVN pointings shown in Fig. 3. The red line is a Gaussian fit to the line profile and the numbers in the top-right corner are the Gaussian parameters of the fit in km s −1.
Current usage metrics show cumulative count of Article Views (full-text article views including HTML views, PDF and ePub downloads, according to the available data) and Abstracts Views on Vision4Press platform.
Data correspond to usage on the plateform after 2015. The current usage metrics is available 48-96 hours after online publication and is updated daily on week days.
Initial download of the metrics may take a while.