Fig. 2
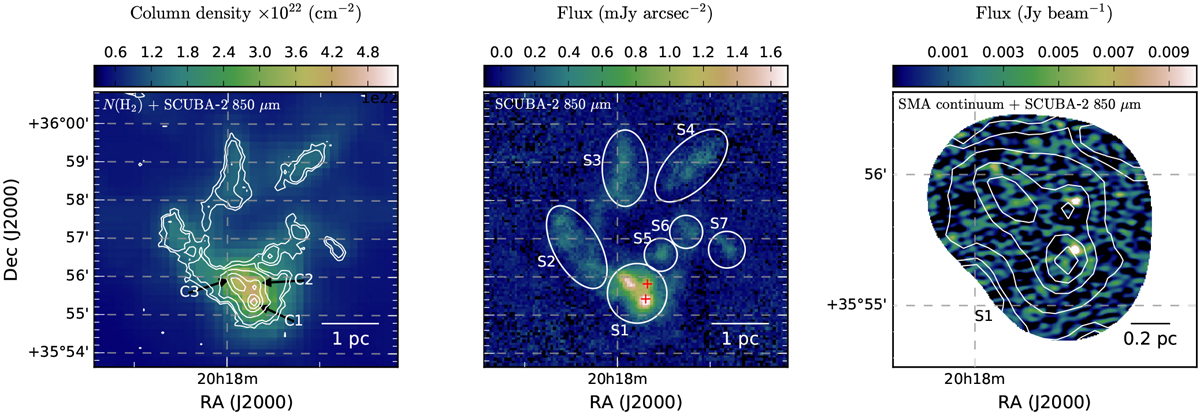
Overview of the dust continuum observations. Left panel: H2 column density map derived form the Herschel observations with the SCUBA-2 observationsat 850 μm shown as contours. Labels C1–C3 indicate three compact sources revealed by SCUBA-2. Middle panel: SCUBA-2 observationsat 850 μm. The circles and ellipses, S1–S7, show the largest substructures in the field and the red crosses show the two continuum sources identified from the SMA observations. Right panel: continuum map derived from the SMA observations; the contours show the SCUBA-2 observations at 850 μm. The area in the right panel corresponds roughly with S1.
Current usage metrics show cumulative count of Article Views (full-text article views including HTML views, PDF and ePub downloads, according to the available data) and Abstracts Views on Vision4Press platform.
Data correspond to usage on the plateform after 2015. The current usage metrics is available 48-96 hours after online publication and is updated daily on week days.
Initial download of the metrics may take a while.