Fig. 11
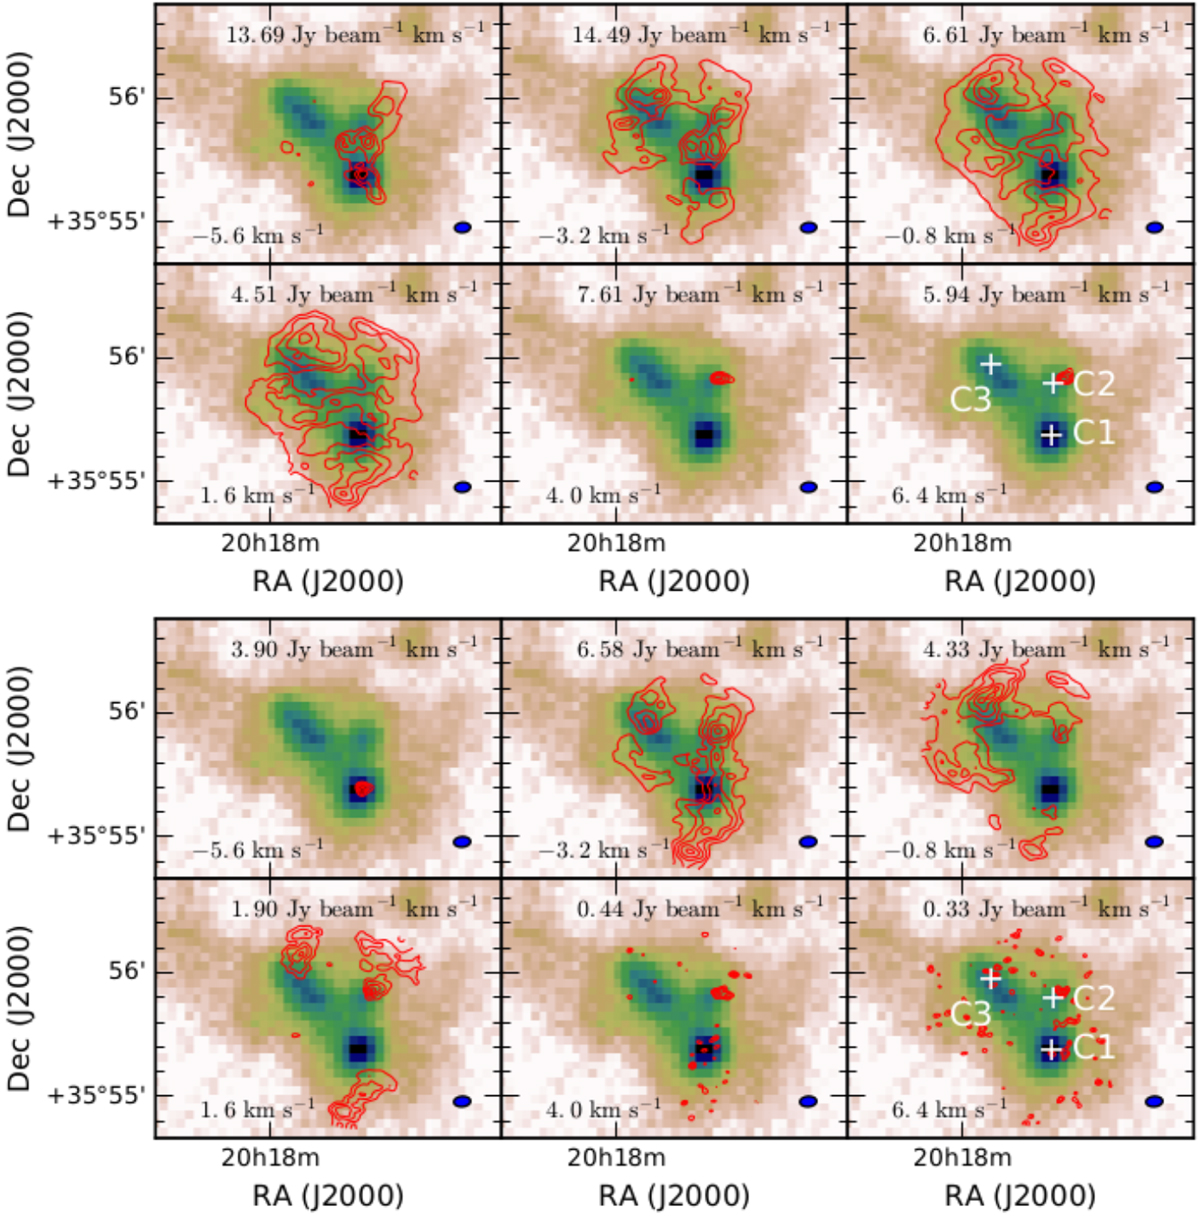
Submillimetre Array 12CO (upper row) and 13CO (lower row) J = 2–1 line observations (red contours) integrated over 2.4 km s−1 wide velocity intervals and plotted over the SCUBA-2 observations at 850 μm. The numbers in the lower left corner show the centre of the velocity bin and the numbers at the top show the maximum intensity of the bin. The beam size is indicated by the blue ellipse in the lower right corner. The white crosses show the location of the three compact sources.
Current usage metrics show cumulative count of Article Views (full-text article views including HTML views, PDF and ePub downloads, according to the available data) and Abstracts Views on Vision4Press platform.
Data correspond to usage on the plateform after 2015. The current usage metrics is available 48-96 hours after online publication and is updated daily on week days.
Initial download of the metrics may take a while.