Fig. 10
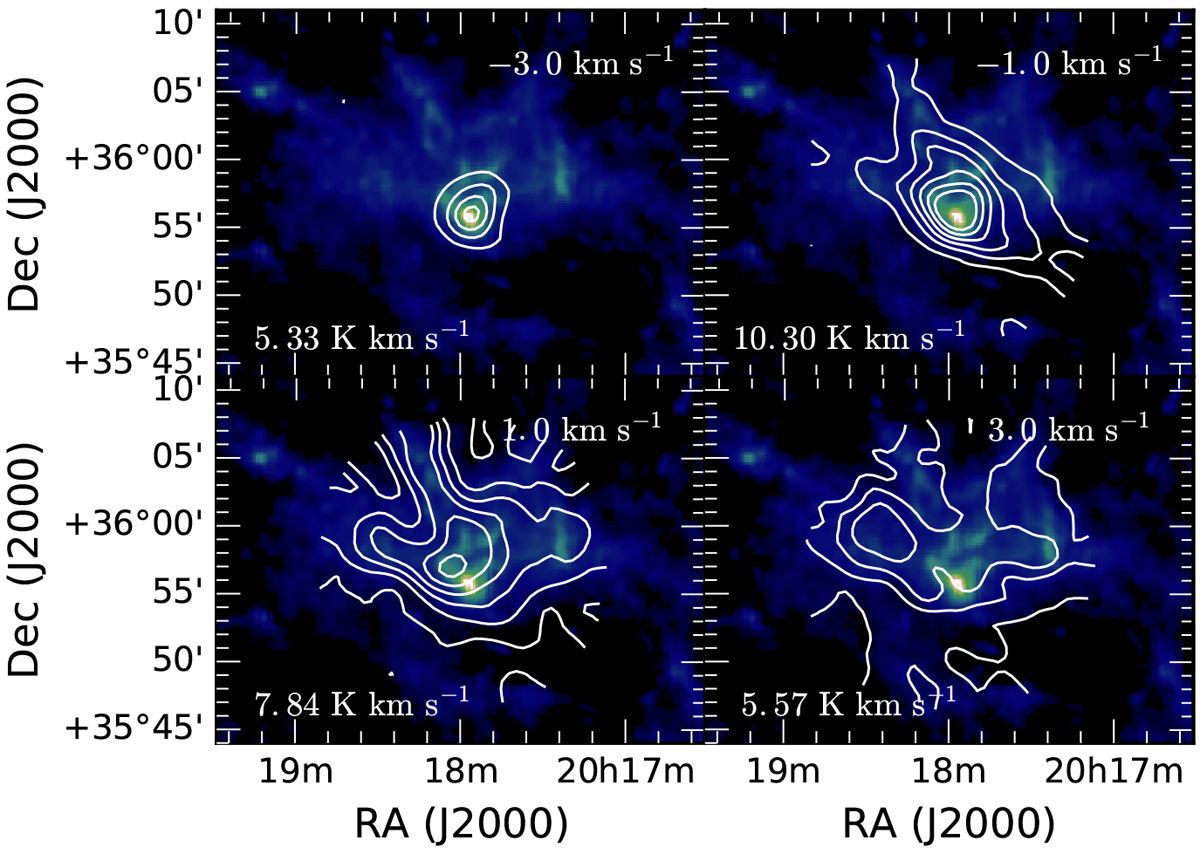
Channel maps of the 13CO J = 1– 0 line emission as observed with the PMO (white contours), superposed on the N(H2) map. The line intensities are integrated over 2.0 km s−1 wide velocity intervals. The velocity centroids are indicated in the top right of each panel and the numbers in the bottom left show the maximum integrated intensity of the bin.
Current usage metrics show cumulative count of Article Views (full-text article views including HTML views, PDF and ePub downloads, according to the available data) and Abstracts Views on Vision4Press platform.
Data correspond to usage on the plateform after 2015. The current usage metrics is available 48-96 hours after online publication and is updated daily on week days.
Initial download of the metrics may take a while.