Open Access
Fig. 4
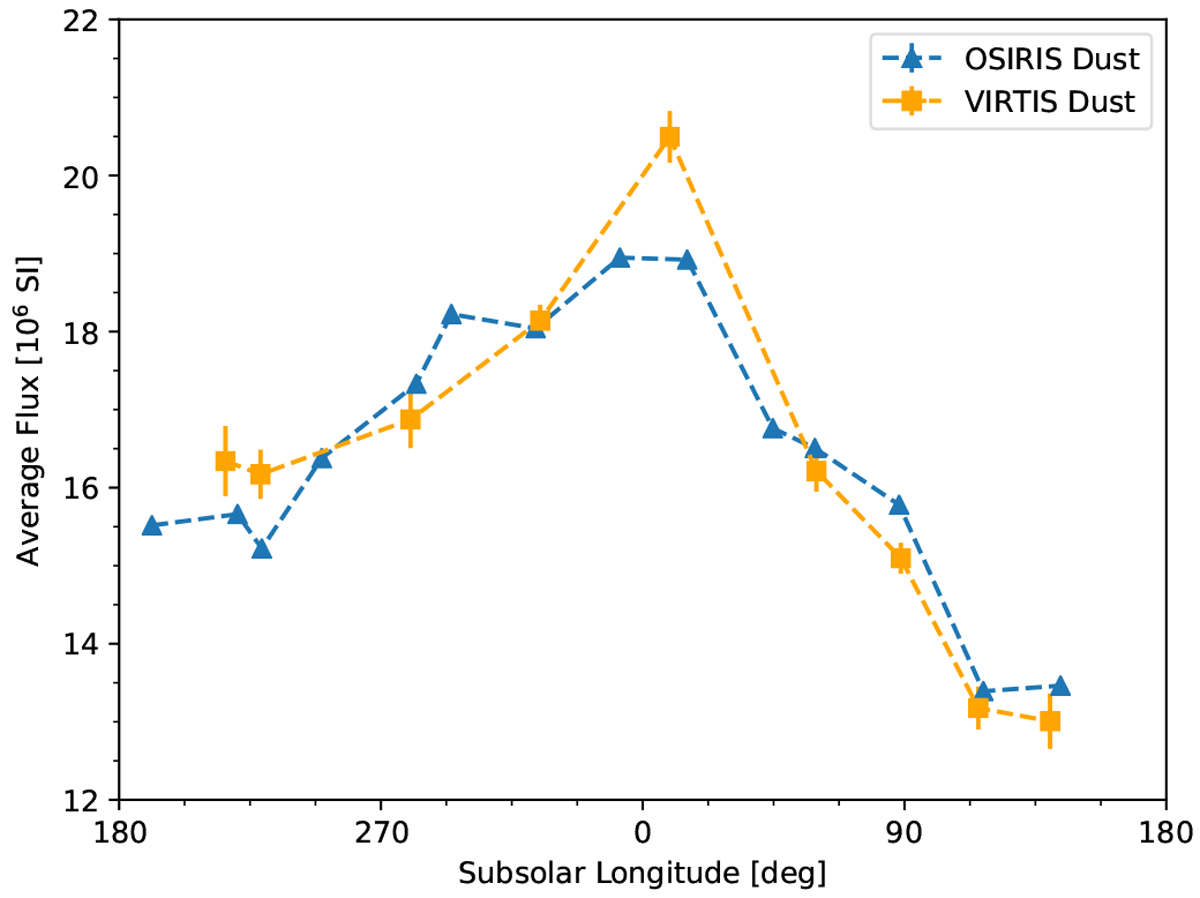
Longitudinal variation of the dust flux. Each data point is the average dust flux inside the ± 45° sector in subsolar direction at 3.1 km from the comet center, measured in OSIRIS (blue) and VIRTIS-M (orange) images. The error bars associated with the OSIRIS data points are too small to be discerned in the plot.
Current usage metrics show cumulative count of Article Views (full-text article views including HTML views, PDF and ePub downloads, according to the available data) and Abstracts Views on Vision4Press platform.
Data correspond to usage on the plateform after 2015. The current usage metrics is available 48-96 hours after online publication and is updated daily on week days.
Initial download of the metrics may take a while.