Fig. 3
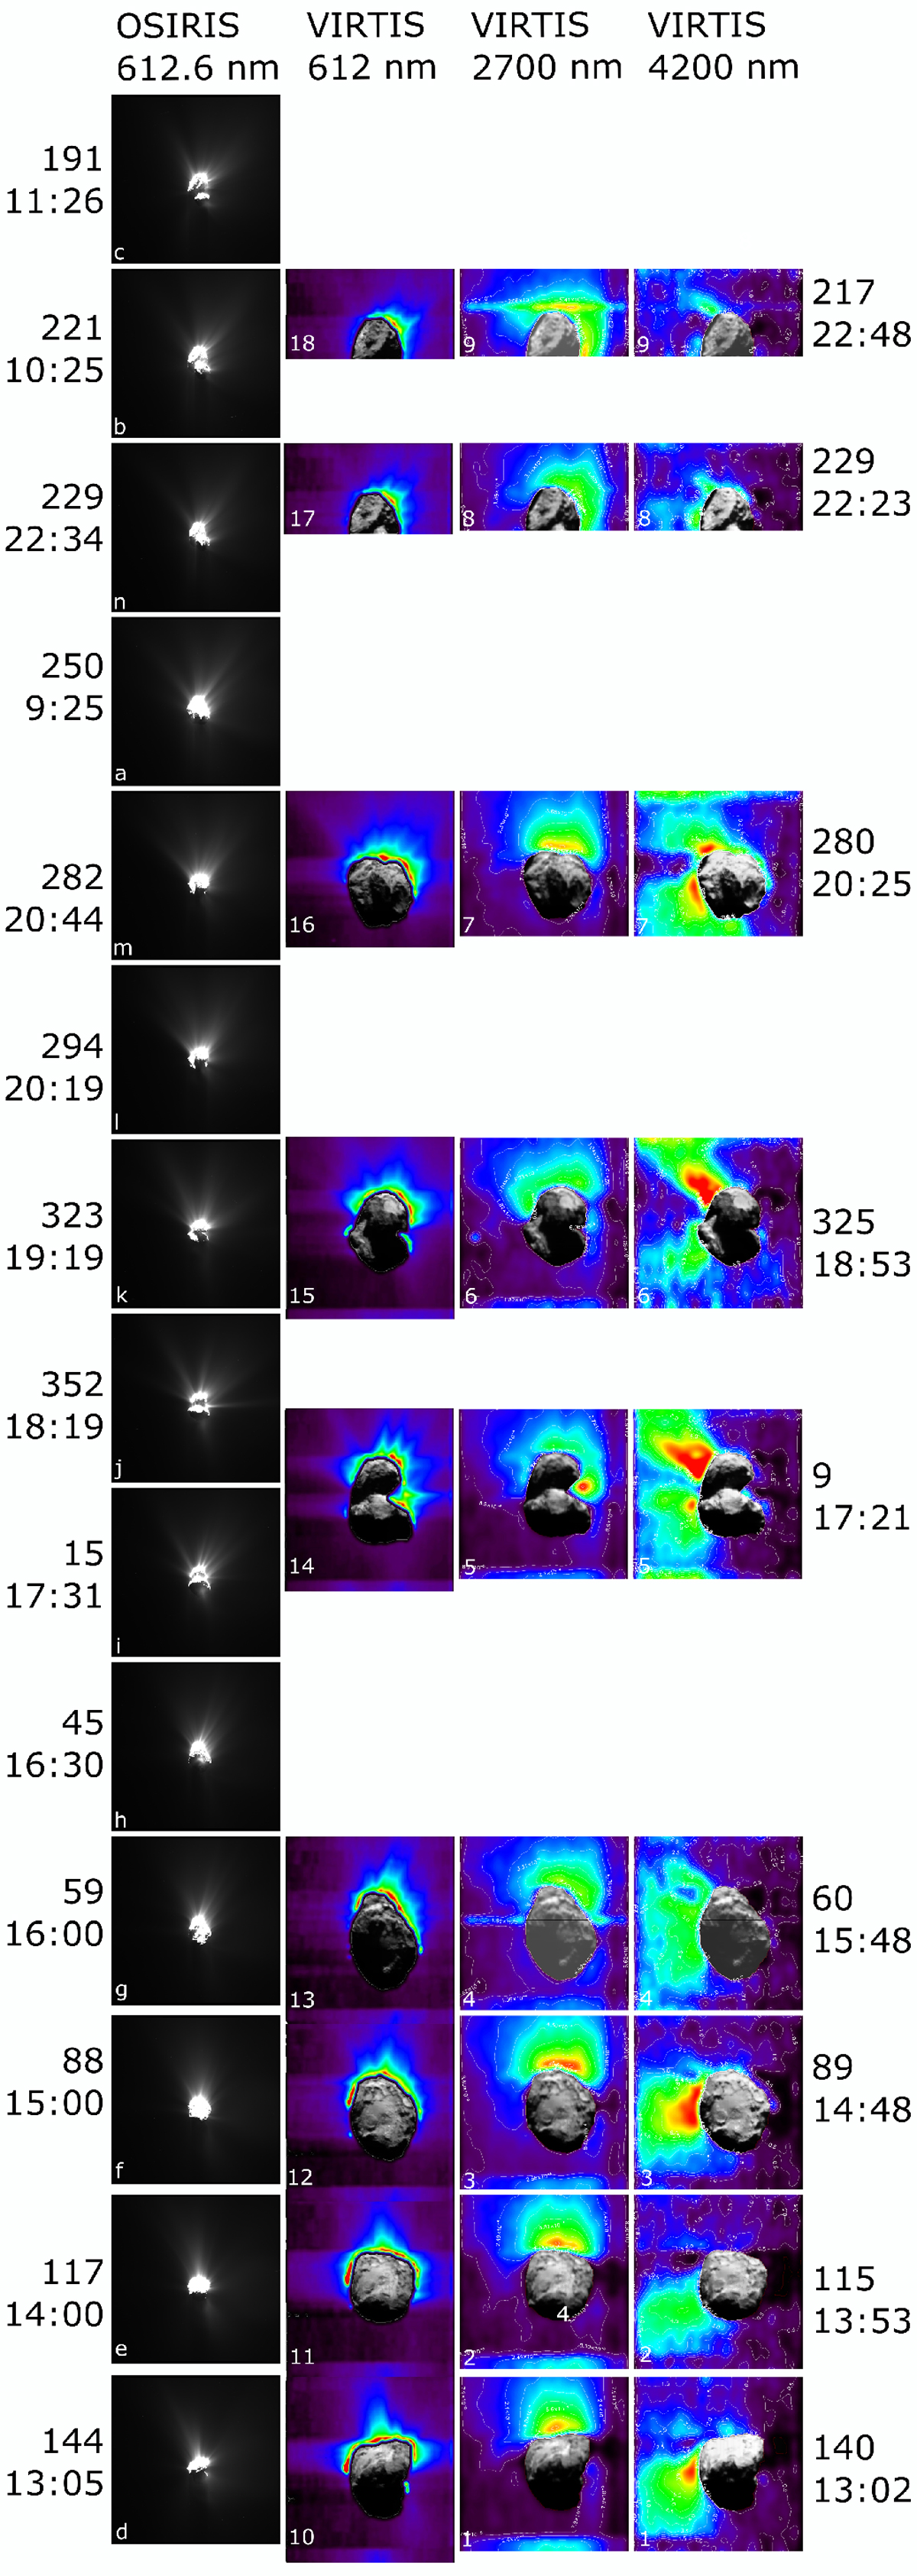
OSIRIS and VIRTIS-M images. For each dataset, the images were scaled to the same brightness level and are displayed in the standard Rosetta orientation, with the Sun up. First column: OSIRIS WAC images in the VIS610 filter. On the left-hand side, the subsolar longitude (in degrees) and start time of each image (in UTC) are listed. Second column: VIRTIS-M image at 612 nm. Third and fourth columns: band intensity maps of H2O and CO2, respectively. For better visualization, a VIRTIS-M image at 4200 nm was inserted into the nucleus area in the images at 612 nm, 2700 nm, and 4200 nm. On the right-hand side, the subsolar longitude (in degrees) and start time of each image (in UTC) are listed. Each image is labeled with the assigned number listed in Col. 1 of Tables 1 and 2.
Current usage metrics show cumulative count of Article Views (full-text article views including HTML views, PDF and ePub downloads, according to the available data) and Abstracts Views on Vision4Press platform.
Data correspond to usage on the plateform after 2015. The current usage metrics is available 48-96 hours after online publication and is updated daily on week days.
Initial download of the metrics may take a while.