Fig. 10
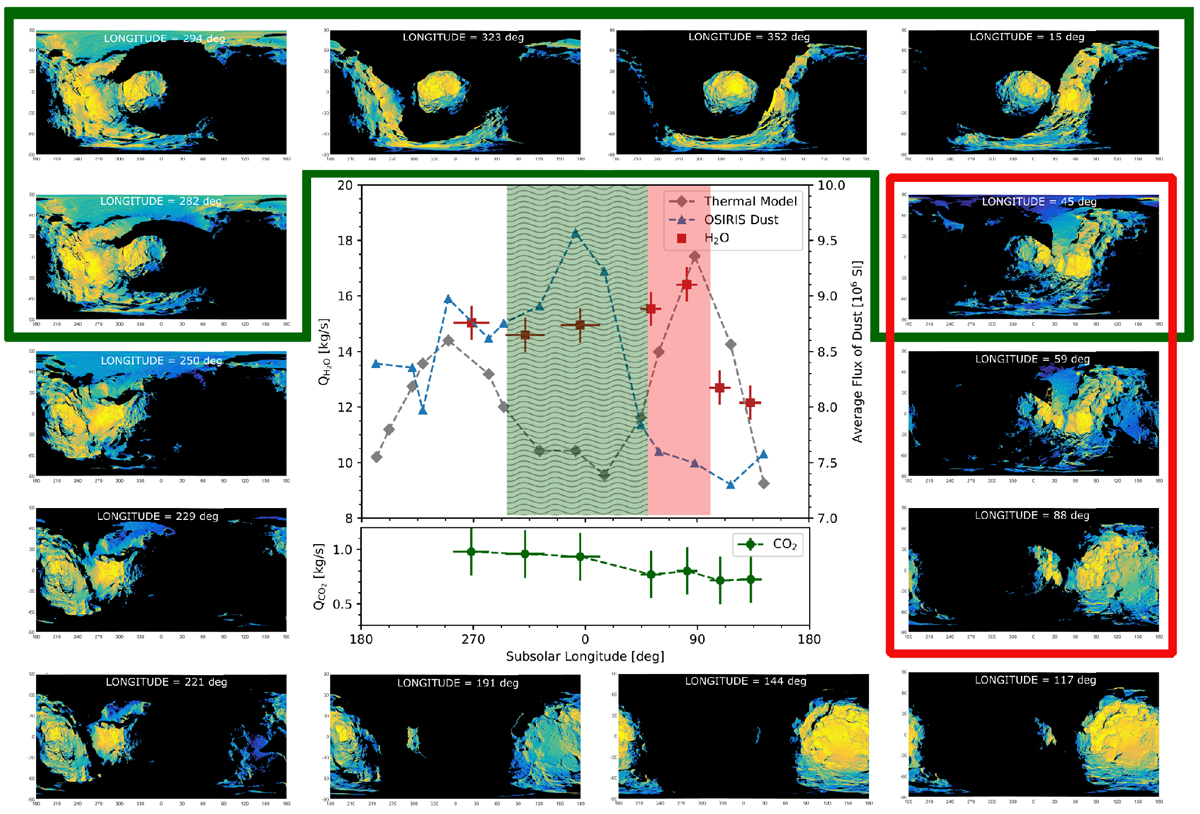
Insolation maps for the time of each OSIRIS observation. Inset: total dust brightness and gas production rates, measured inthe full 3.1 km annulus, as functions of subsolar longitude. The green box encloses the insolation maps that correspond to the subsolar longitudes where an excess of measured water production was found, relative to a simple model. The red box frames the insolation maps that correspond to the subsolar longitudes where a minimum of dust and a maximum of water production were measured.
Current usage metrics show cumulative count of Article Views (full-text article views including HTML views, PDF and ePub downloads, according to the available data) and Abstracts Views on Vision4Press platform.
Data correspond to usage on the plateform after 2015. The current usage metrics is available 48-96 hours after online publication and is updated daily on week days.
Initial download of the metrics may take a while.