Fig. 1
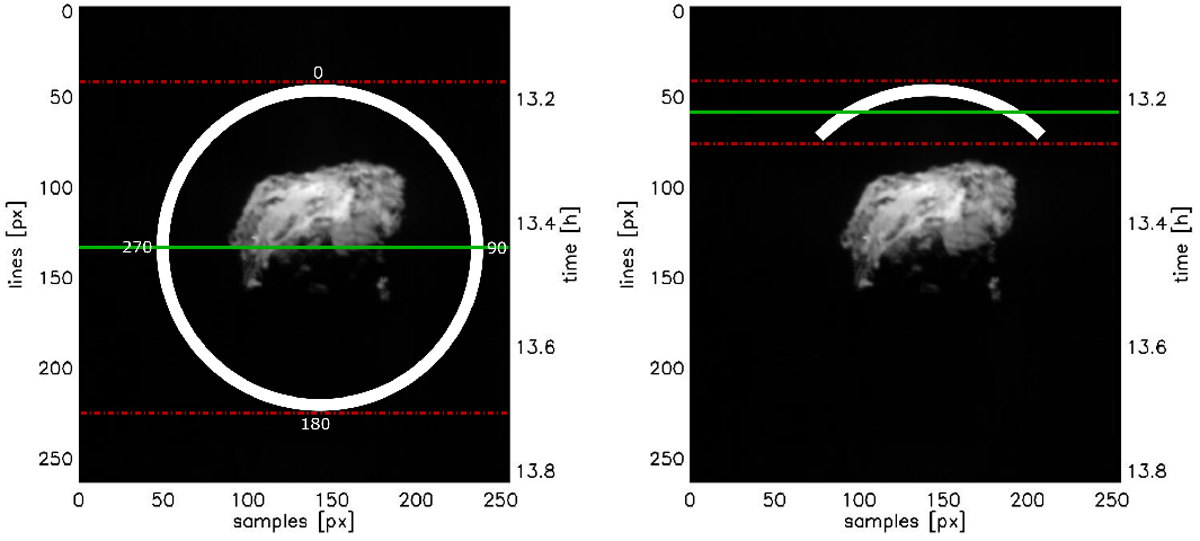
Example of masks used for aperture photometry measurements: the ±45° sector (right panel) and the annulus (left panel) superimposed on a VIRTIS-M image at 1100 nm (selected to show the nucleus at the same scale). The two vertical axes in each image show the operation mode of VIRTIS-M: the instrument scans spatially (number of the line on the left) and temporally (time on the right) through the coma and nucleus of the comet. The green line indicates the mid-point inside each mask for the ±45° sector and the full annulus.
Current usage metrics show cumulative count of Article Views (full-text article views including HTML views, PDF and ePub downloads, according to the available data) and Abstracts Views on Vision4Press platform.
Data correspond to usage on the plateform after 2015. The current usage metrics is available 48-96 hours after online publication and is updated daily on week days.
Initial download of the metrics may take a while.