Fig. 2.
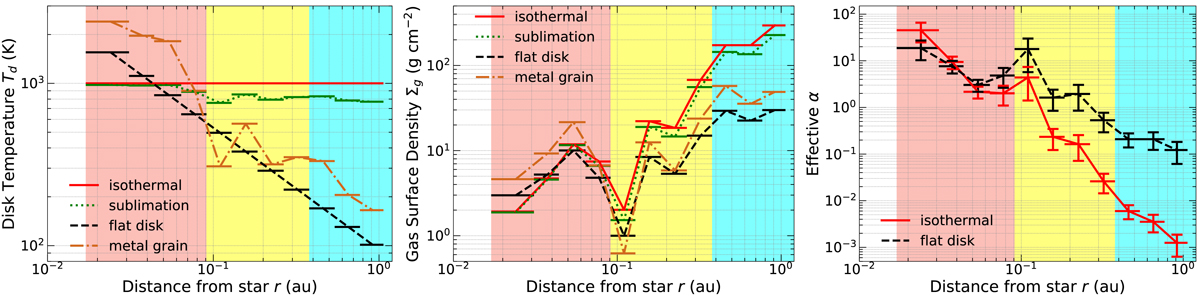
Resulting structures of Td, Σg, and α as a function of the distance from the central star in the left, central, and right panels, respectively. The results for the isothermal case are denoted by the red solid line, those for the sublimation case by the green dotted line, those for the flat disk case by the black dashed line, and those for the metal grain case by the orange dash-dotted line. As in Fig. 1, the horizontal bars are displayed while error bars are omitted for the purpose of clear presentation in the left and central panels. Both the horizontal bars and error bars are displayed in the right panel.
Current usage metrics show cumulative count of Article Views (full-text article views including HTML views, PDF and ePub downloads, according to the available data) and Abstracts Views on Vision4Press platform.
Data correspond to usage on the plateform after 2015. The current usage metrics is available 48-96 hours after online publication and is updated daily on week days.
Initial download of the metrics may take a while.