Fig. 9.
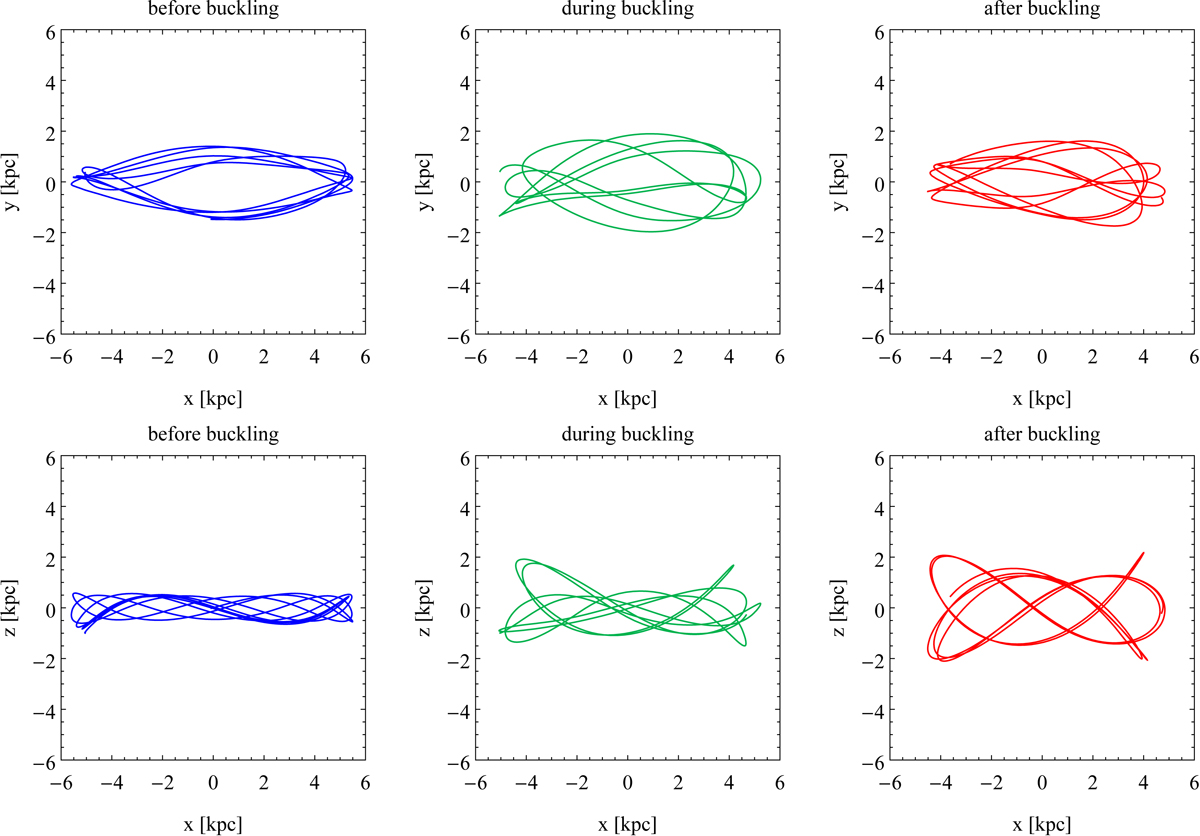
Example of a buckling orbit. The orbit is plotted in different colors in three time periods: before, during, and after buckling (from the left to the right panel) and in two projections: in the face-on and edge-on view (the top and bottom row, respectively). After buckling the star follows a regular, periodic, pretzel-like orbit with frequency ratio fz, after/fx, after = 7/4, that is it completes four oscillations in x for every seven oscillations in z.
Current usage metrics show cumulative count of Article Views (full-text article views including HTML views, PDF and ePub downloads, according to the available data) and Abstracts Views on Vision4Press platform.
Data correspond to usage on the plateform after 2015. The current usage metrics is available 48-96 hours after online publication and is updated daily on week days.
Initial download of the metrics may take a while.