Fig. 6.
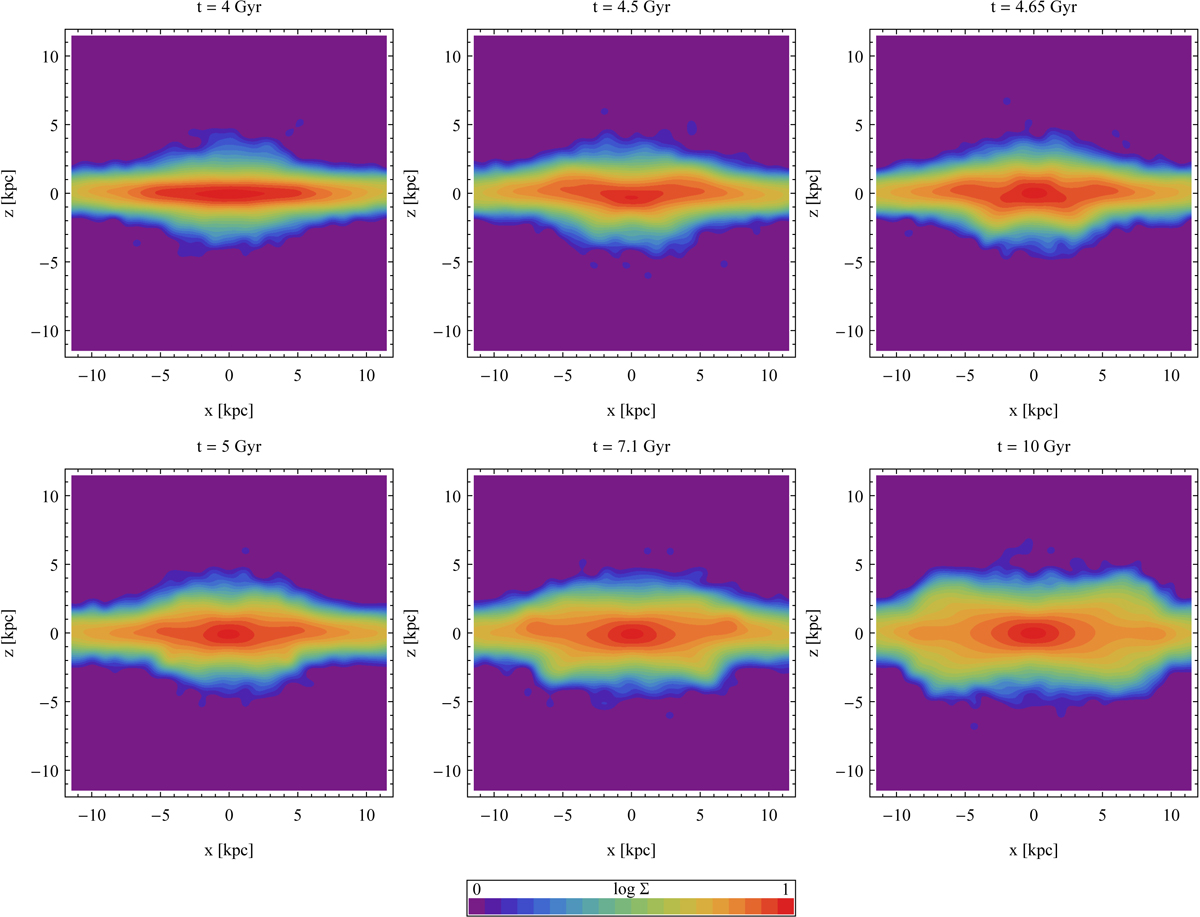
Surface density distributions of the stellar component viewed edge-on before the first buckling (t = 4 Gyr), at the time of first buckling (t = 4.5, 4.65 and 5 Gyr), at the time of second buckling (t = 7.1 Gyr), and at the end of evolution (t = 10 Gyr). The surface density was normalized to the central maximum value in each case and the contours are equally spaced in logΣ with ΔlogΣ = 0.05.
Current usage metrics show cumulative count of Article Views (full-text article views including HTML views, PDF and ePub downloads, according to the available data) and Abstracts Views on Vision4Press platform.
Data correspond to usage on the plateform after 2015. The current usage metrics is available 48-96 hours after online publication and is updated daily on week days.
Initial download of the metrics may take a while.