Fig. 14.
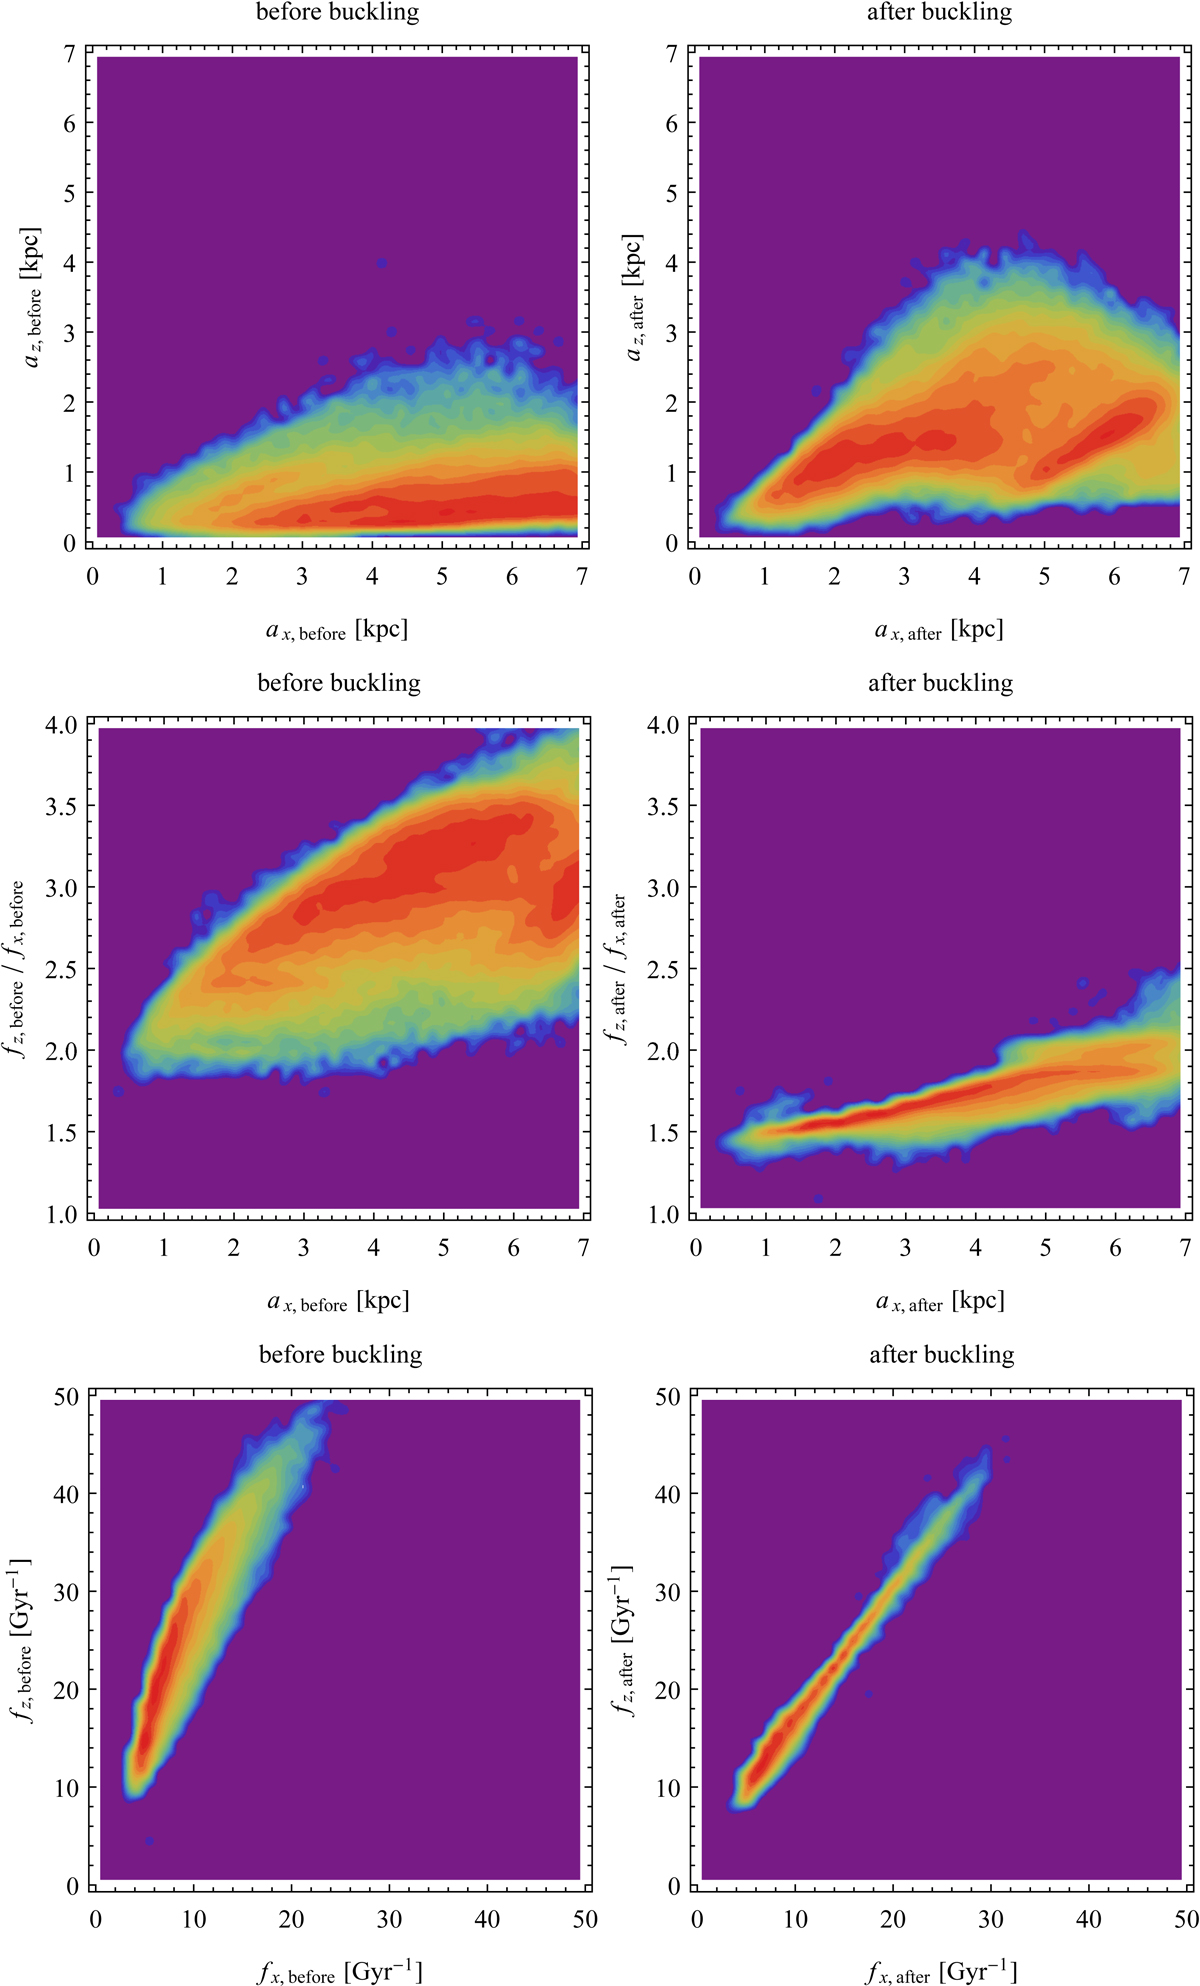
Comparison of the properties of stellar orbits before (left column) and after (right column) buckling. The first row of plots shows the distribution of values of the amplitude in the z direction as a function of the amplitude in x. The second row shows the distribution of stars in the plane of frequency ratio and amplitude of oscillations in the x direction. The third row shows the distribution of stars in the fz–fx frequency plane.
Current usage metrics show cumulative count of Article Views (full-text article views including HTML views, PDF and ePub downloads, according to the available data) and Abstracts Views on Vision4Press platform.
Data correspond to usage on the plateform after 2015. The current usage metrics is available 48-96 hours after online publication and is updated daily on week days.
Initial download of the metrics may take a while.