Free Access
Fig. 1.
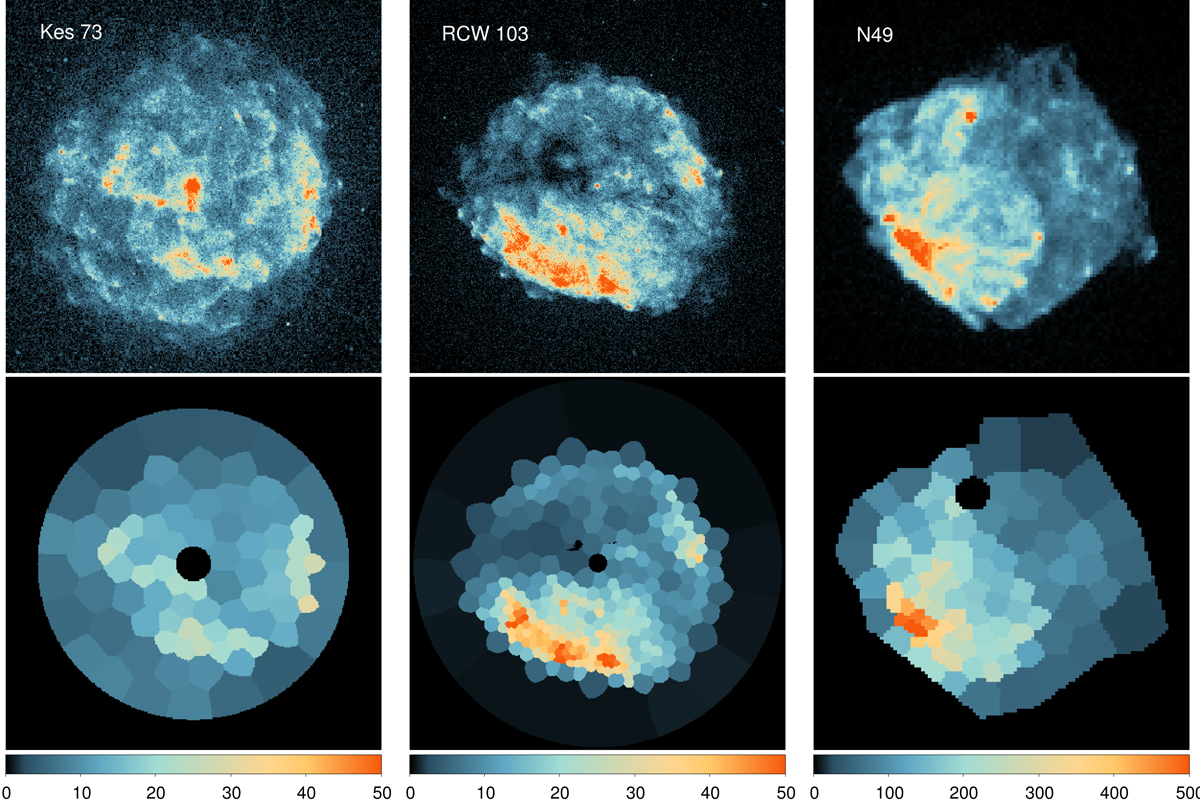
Upper panels: merged Chandra images of three SNRs in the 0.3–7.0 keV energy band. Lower panels: adaptively binned images with the magnetars removed. The colorbars show the counts number per pixel (1″).
Current usage metrics show cumulative count of Article Views (full-text article views including HTML views, PDF and ePub downloads, according to the available data) and Abstracts Views on Vision4Press platform.
Data correspond to usage on the plateform after 2015. The current usage metrics is available 48-96 hours after online publication and is updated daily on week days.
Initial download of the metrics may take a while.