Fig. 8
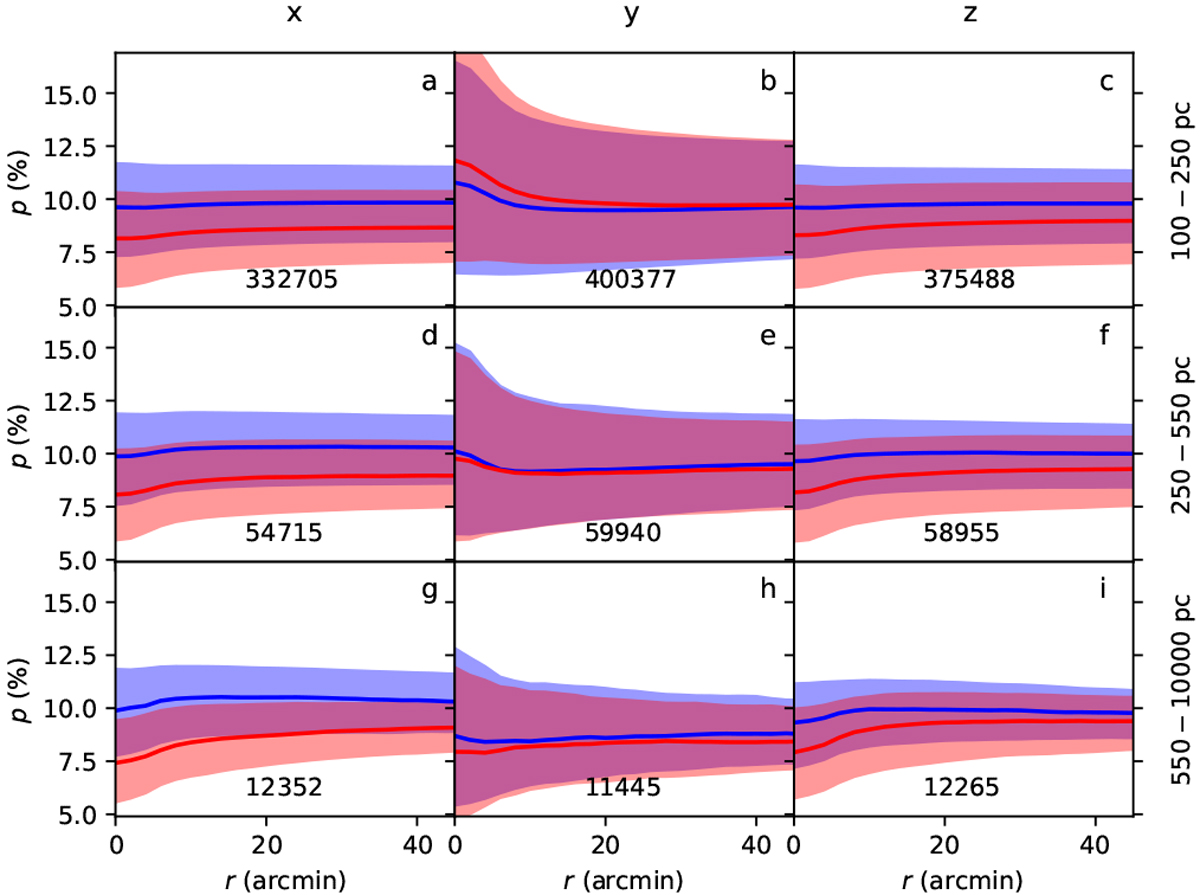
Radial profiles of median polarisation fraction p. The clump sample is the same as in Fig. 7. The red and blue colours correspond to clumps with the central surface brightness respectively above or below the median value. The shaded regions show the inter-quartile ranges. The total number of clumps is indicated in each frame. The y-direction p values have been multiplied by a factor of four in the plot.
Current usage metrics show cumulative count of Article Views (full-text article views including HTML views, PDF and ePub downloads, according to the available data) and Abstracts Views on Vision4Press platform.
Data correspond to usage on the plateform after 2015. The current usage metrics is available 48-96 hours after online publication and is updated daily on week days.
Initial download of the metrics may take a while.