Fig. 7
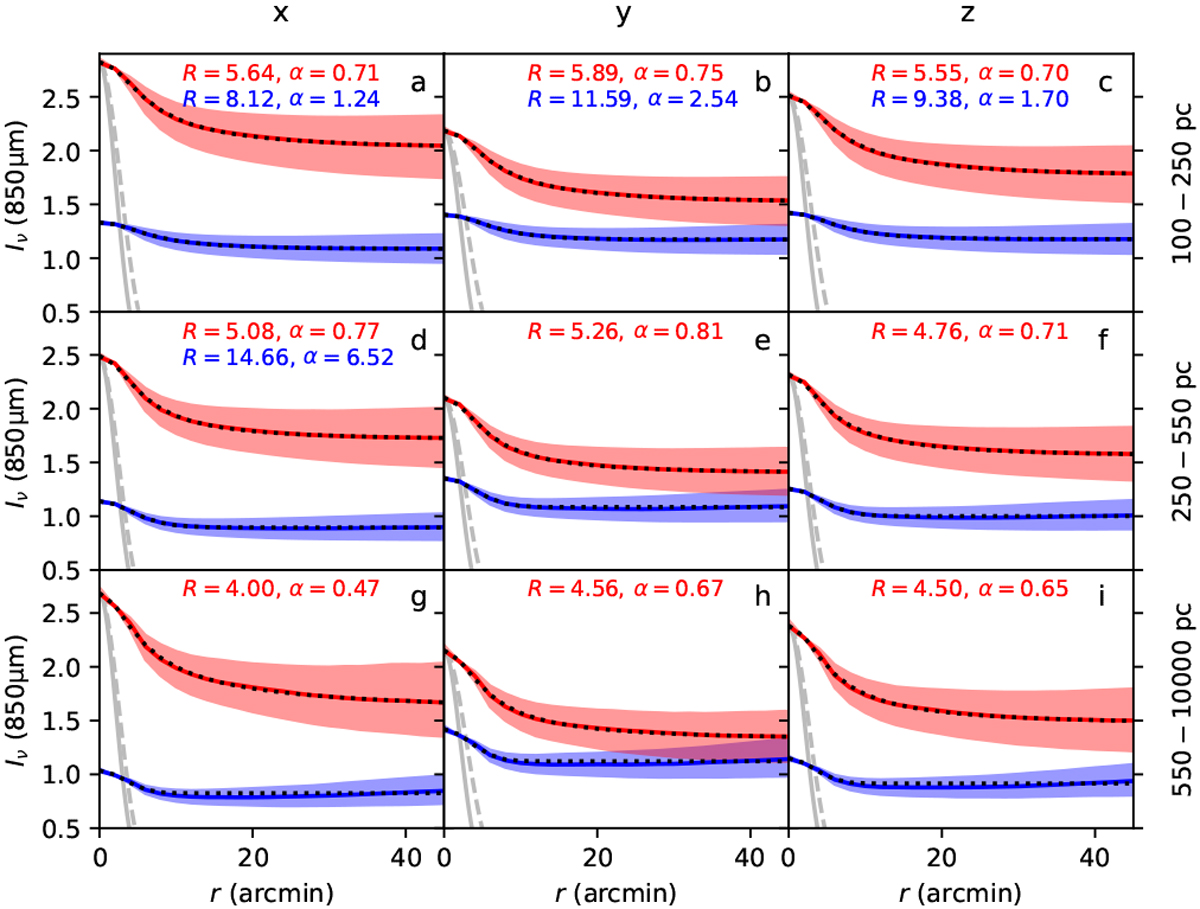
Overview of 850 μm (353 GHz) intensity profiles of extracted clumps, divided according to view direction (columns) and distance (rows). Clumps with the central intensity above (red curves) and below (blue curves) the median intensity are plotted separately. The values are total intensities without background subtraction, normalised to the sample median value at the centre. The shaded regions correspond to the inter-quartile range. The median profiles are shown as dotted lines with the parameters R and α (see text) quoted in the frames. The Gaussians corresponding to the FWHM =5.0′ beam and the median major axis FWHM of the extracted clumps (cold component) are plotted with solid and dashed grey lines, respectively.
Current usage metrics show cumulative count of Article Views (full-text article views including HTML views, PDF and ePub downloads, according to the available data) and Abstracts Views on Vision4Press platform.
Data correspond to usage on the plateform after 2015. The current usage metrics is available 48-96 hours after online publication and is updated daily on week days.
Initial download of the metrics may take a while.