Fig. 3
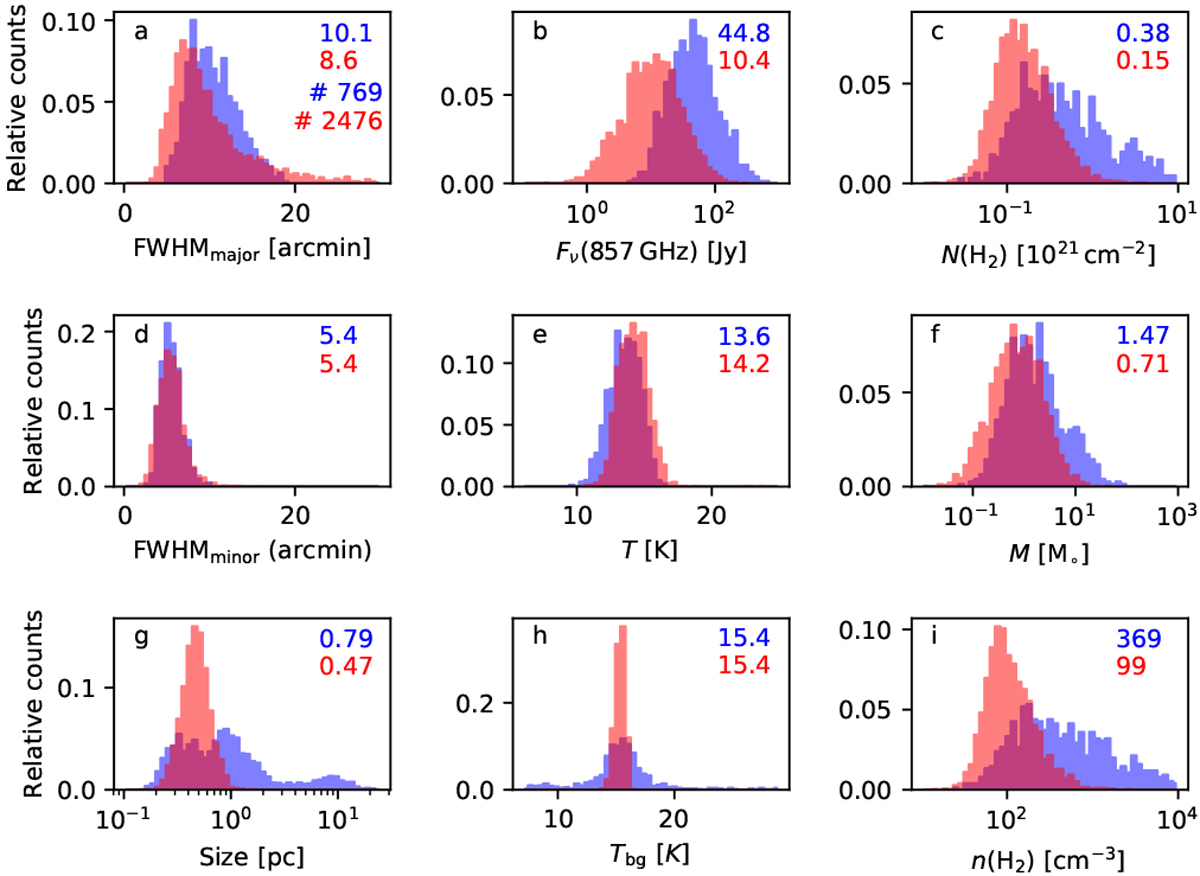
Normalised parameter distributions for clumps in snapshot 377, direction x and distance 231 pc (red histograms). The blue histograms show the corresponding distributions for PGCC sources with within 50% the same distance. The mean values of the parameters are shown for the PGCC catalogue (upper numbers in blue) and for the simulated catalogue (lower numbers in red). The first frame also shows the number of clumps included in the plots.
Current usage metrics show cumulative count of Article Views (full-text article views including HTML views, PDF and ePub downloads, according to the available data) and Abstracts Views on Vision4Press platform.
Data correspond to usage on the plateform after 2015. The current usage metrics is available 48-96 hours after online publication and is updated daily on week days.
Initial download of the metrics may take a while.