Fig. B.1
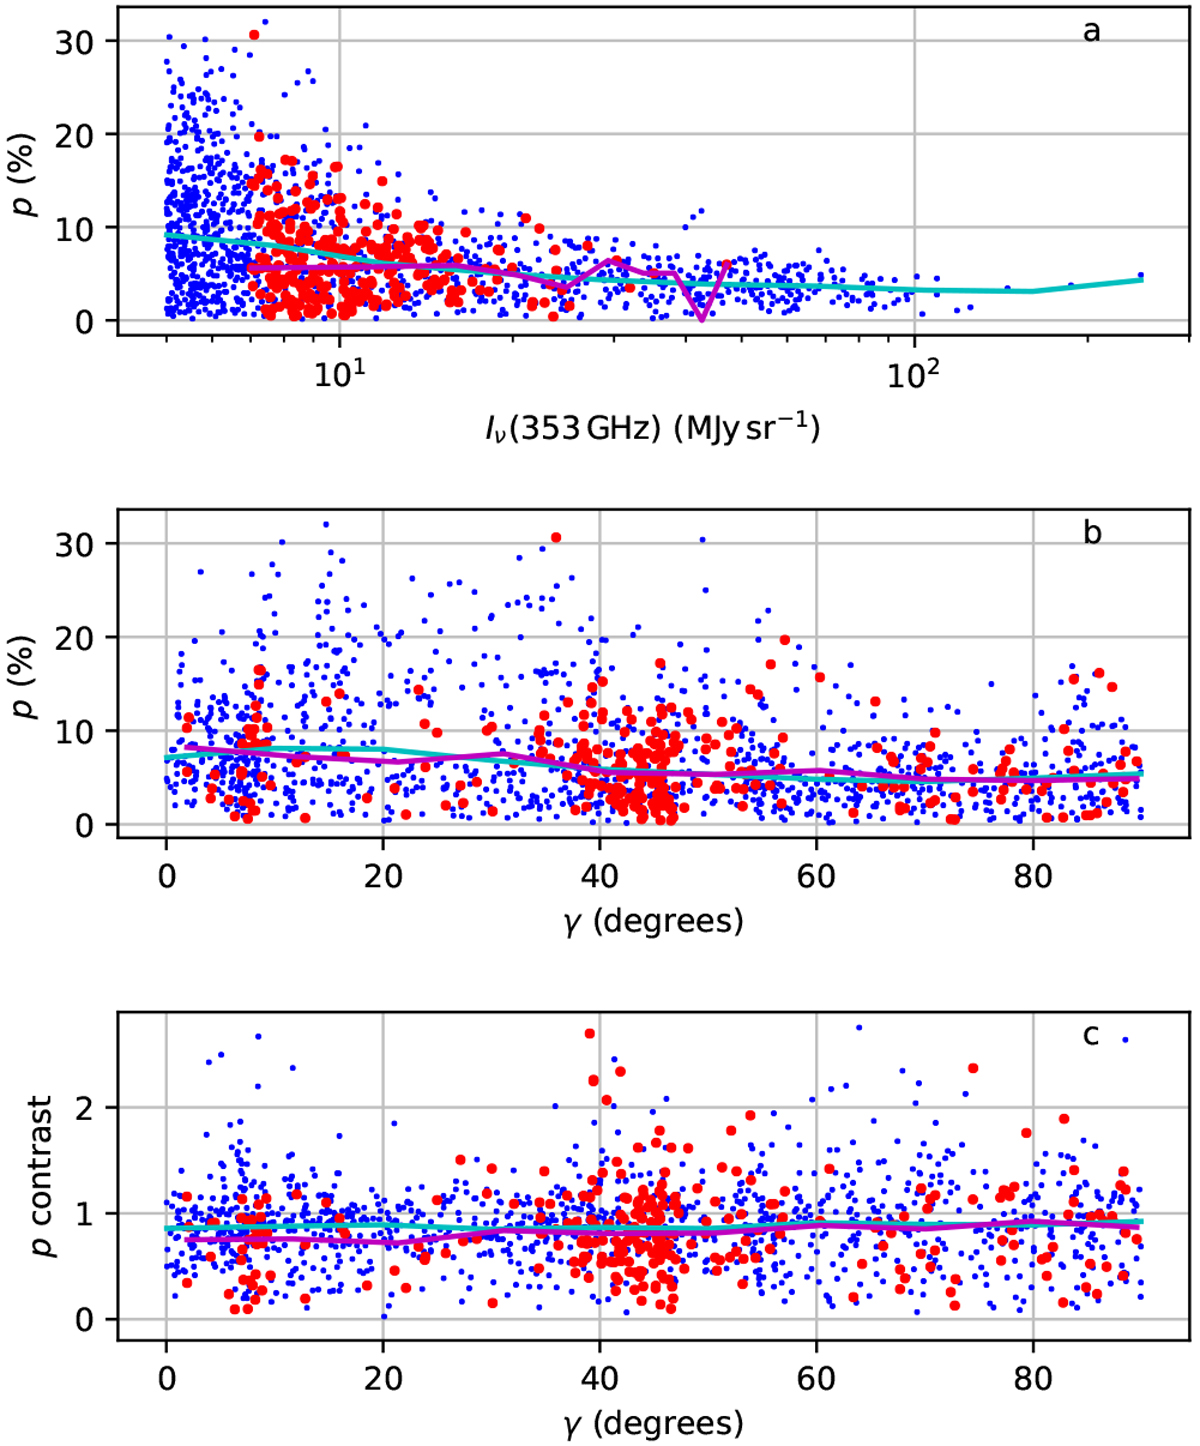
Polarisation fraction associated to selected PGCC clumps. The first frame shows the relation p vs. intensity when both are measured at the clump centres. The second frame shows p as a functionof the estimated γ angle. The last frame shows the same for the p contrast (p at the clumpcentre divided by the average over radial distances 16–20′). The blue and red colours correspond to two clump samples (see text). The cyan and magenta lines show the corresponding median values calculated with a moving window with the width one tenth of the data range.
Current usage metrics show cumulative count of Article Views (full-text article views including HTML views, PDF and ePub downloads, according to the available data) and Abstracts Views on Vision4Press platform.
Data correspond to usage on the plateform after 2015. The current usage metrics is available 48-96 hours after online publication and is updated daily on week days.
Initial download of the metrics may take a while.