Fig. A.4
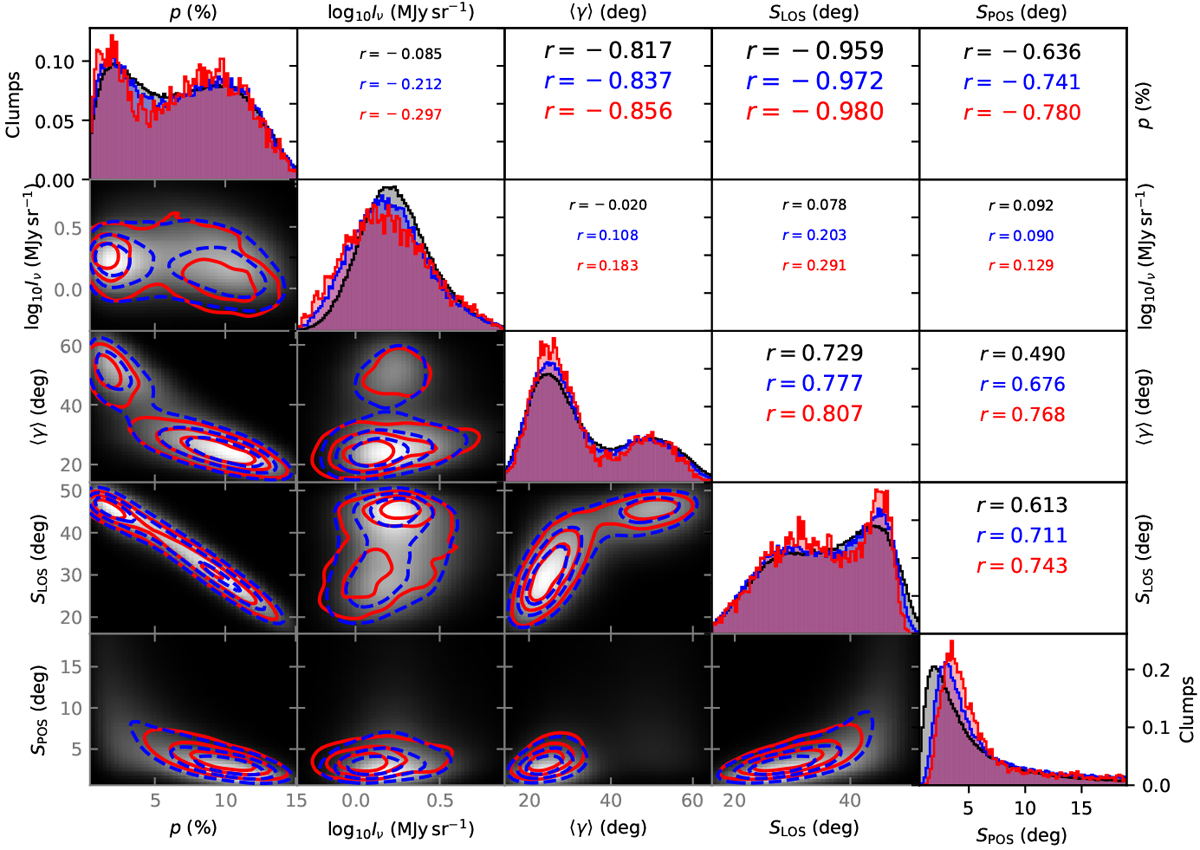
As Fig. 13 but comparing default models at different distances. The background images and histograms plotted with black lines are for d = 152 pc. Data for distances d = 533 pc and d = 1232 pc are drawn with blue and red lines (and contours), respectively. The correlation coefficients in the frames above the diagonal arewritten in the corresponding colours.
Current usage metrics show cumulative count of Article Views (full-text article views including HTML views, PDF and ePub downloads, according to the available data) and Abstracts Views on Vision4Press platform.
Data correspond to usage on the plateform after 2015. The current usage metrics is available 48-96 hours after online publication and is updated daily on week days.
Initial download of the metrics may take a while.