Fig. A.1
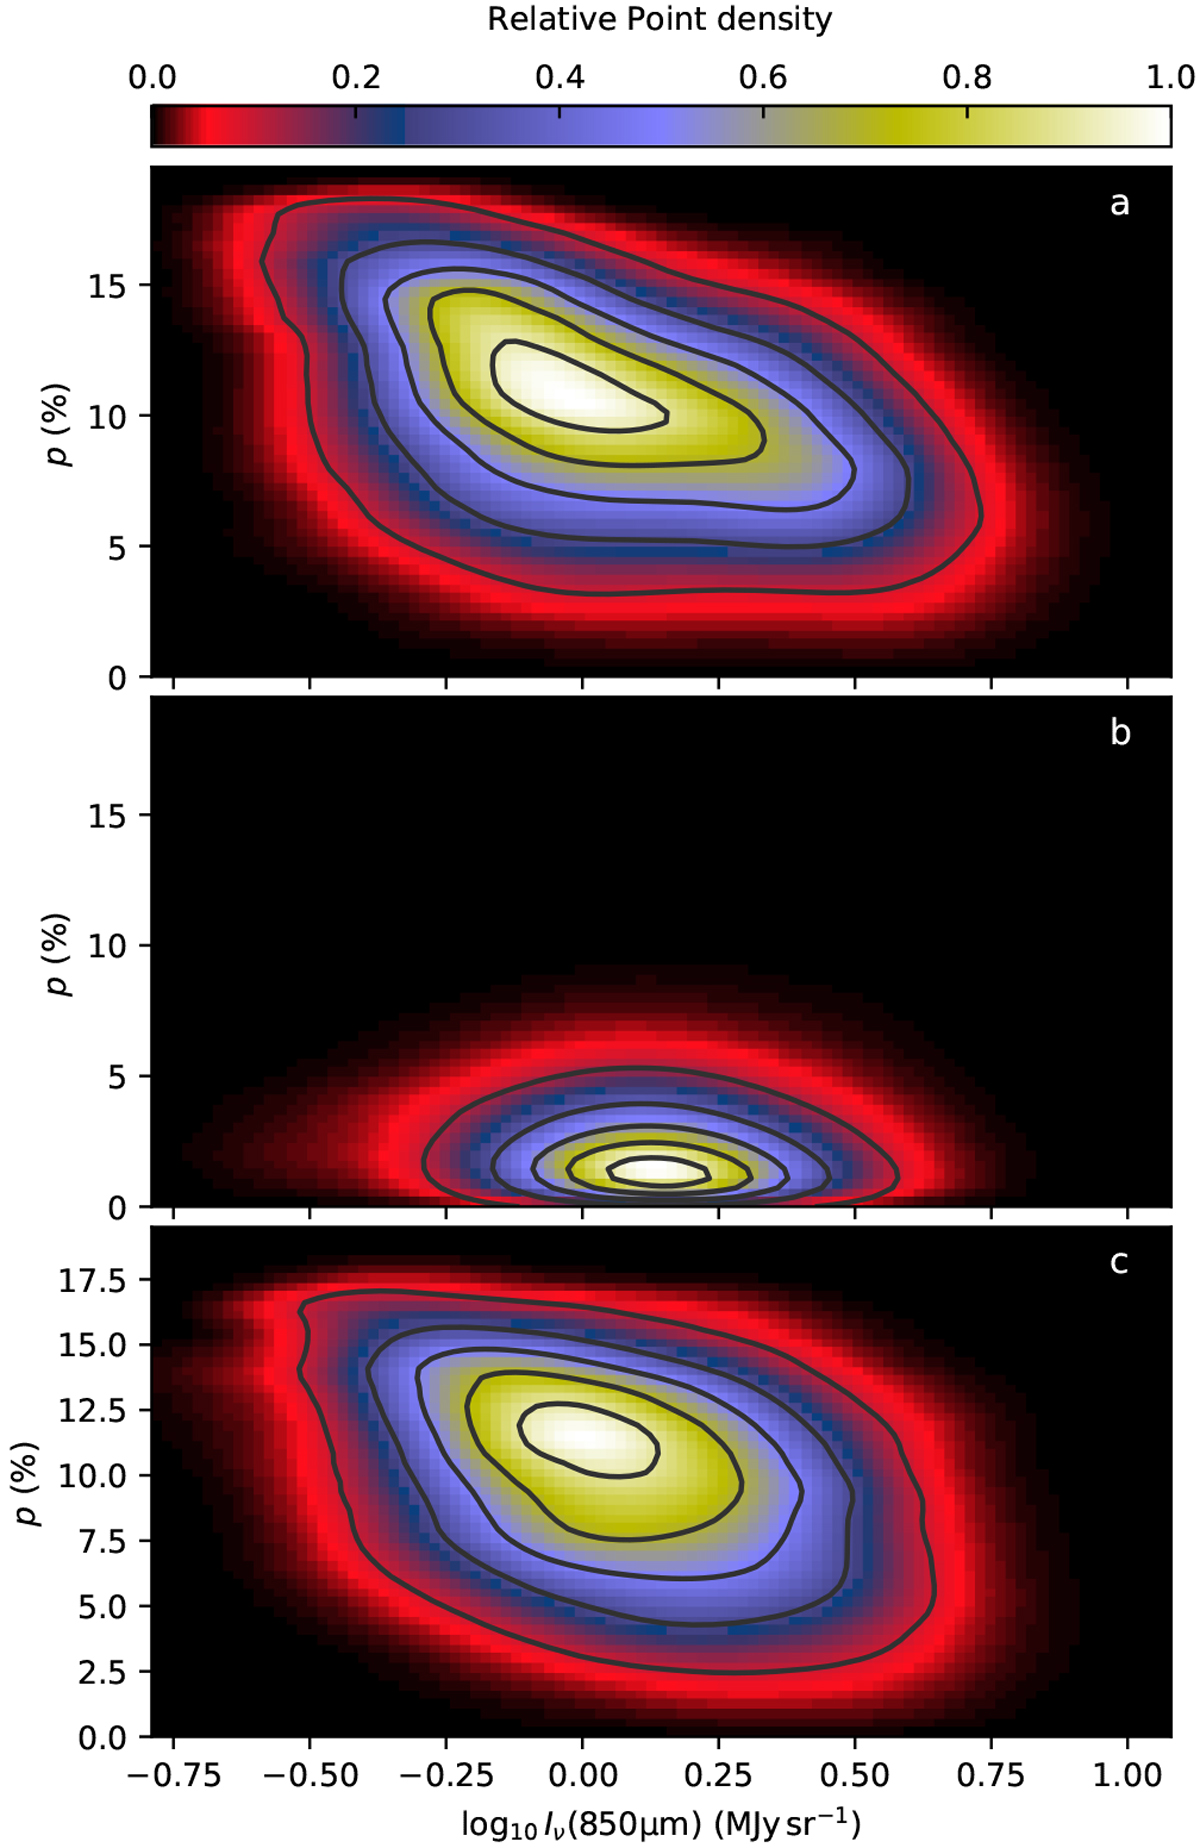
Polarisation fraction as function of 850 μm intensity over whole snapshot 377 (model D). The frames a–c correspond, respectively, to the view directions x, y, and z. The colour images show the distribution for the full-resolution maps and the contours (drawn in steps of 10% between 10 and 90% of the maximum value) for lower-resolution data that correspond to a distance of 351 pc.
Current usage metrics show cumulative count of Article Views (full-text article views including HTML views, PDF and ePub downloads, according to the available data) and Abstracts Views on Vision4Press platform.
Data correspond to usage on the plateform after 2015. The current usage metrics is available 48-96 hours after online publication and is updated daily on week days.
Initial download of the metrics may take a while.