Fig. 21
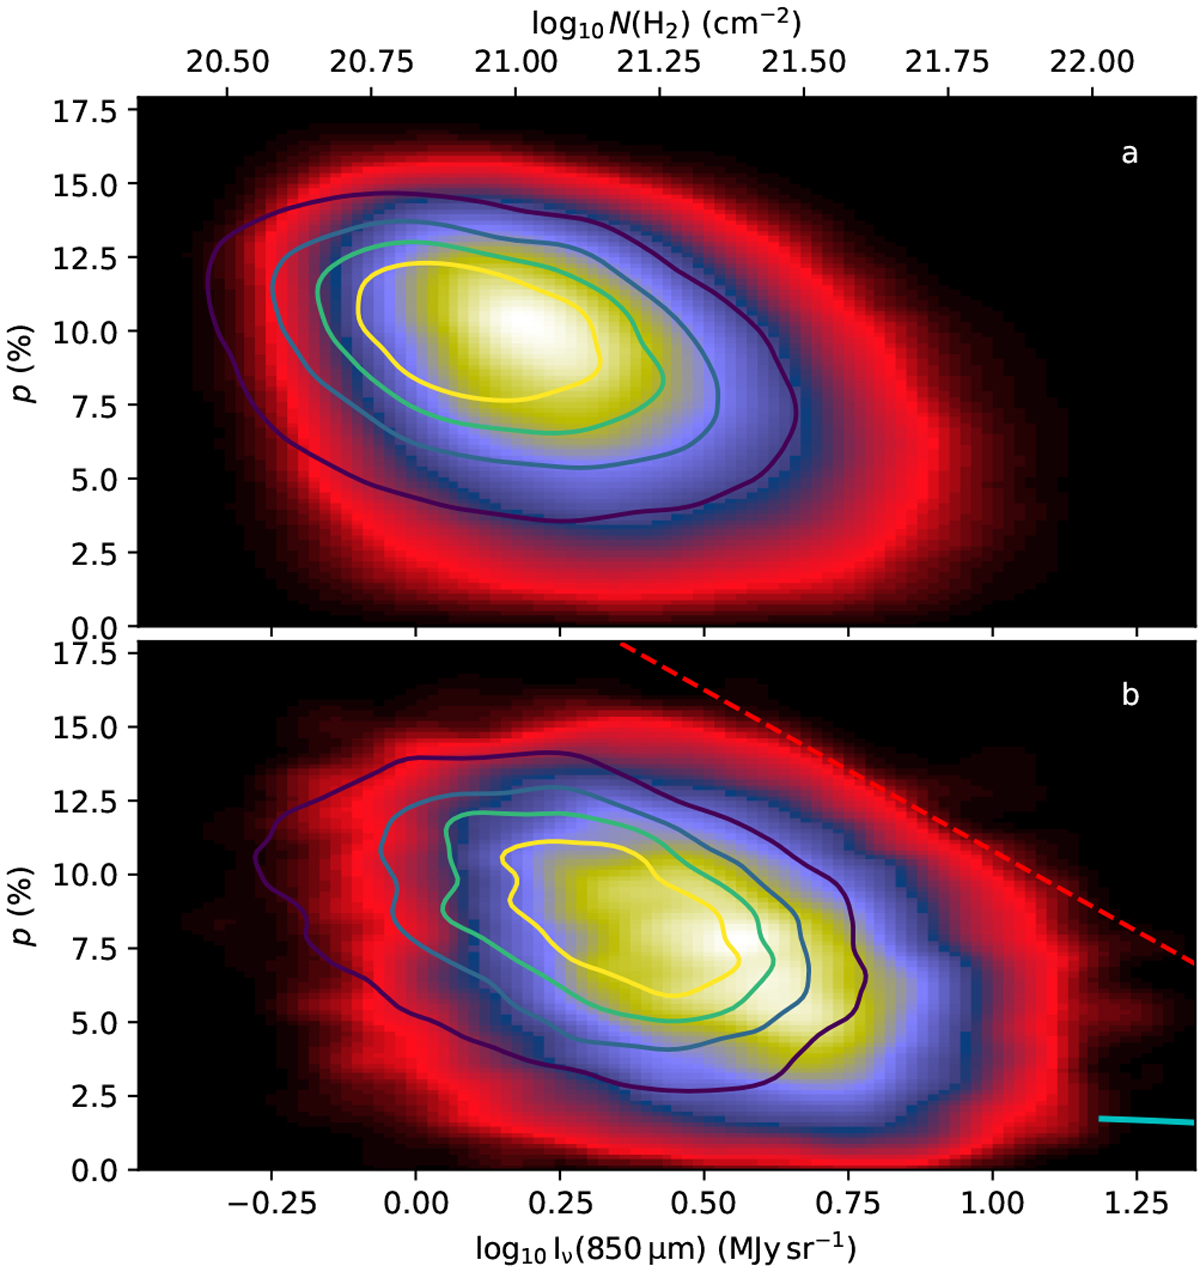
Relations p vs. Iν for clump centres (colour images) and for background at 30′ distance (contours, in steps of 0.2 from 0.1 to 0.9 of the peak value). The plots include all clumps at d = 231 pc viewed from the x and y directions (frame a) and a subset with S/N > 10 and Td< 13 K (frame b). The dashed red line in frame b shows the upper envelope derived in Planck Collaboration Int. XX (2015). The cyan line is the relation estimated for the dense filament G035.39-00.33 (Juvela et al. 2018c) and is drawn for N(H2) > 1022 cm−2. The column density scale corresponding to Td = 15 K.
Current usage metrics show cumulative count of Article Views (full-text article views including HTML views, PDF and ePub downloads, according to the available data) and Abstracts Views on Vision4Press platform.
Data correspond to usage on the plateform after 2015. The current usage metrics is available 48-96 hours after online publication and is updated daily on week days.
Initial download of the metrics may take a while.