Fig. 19
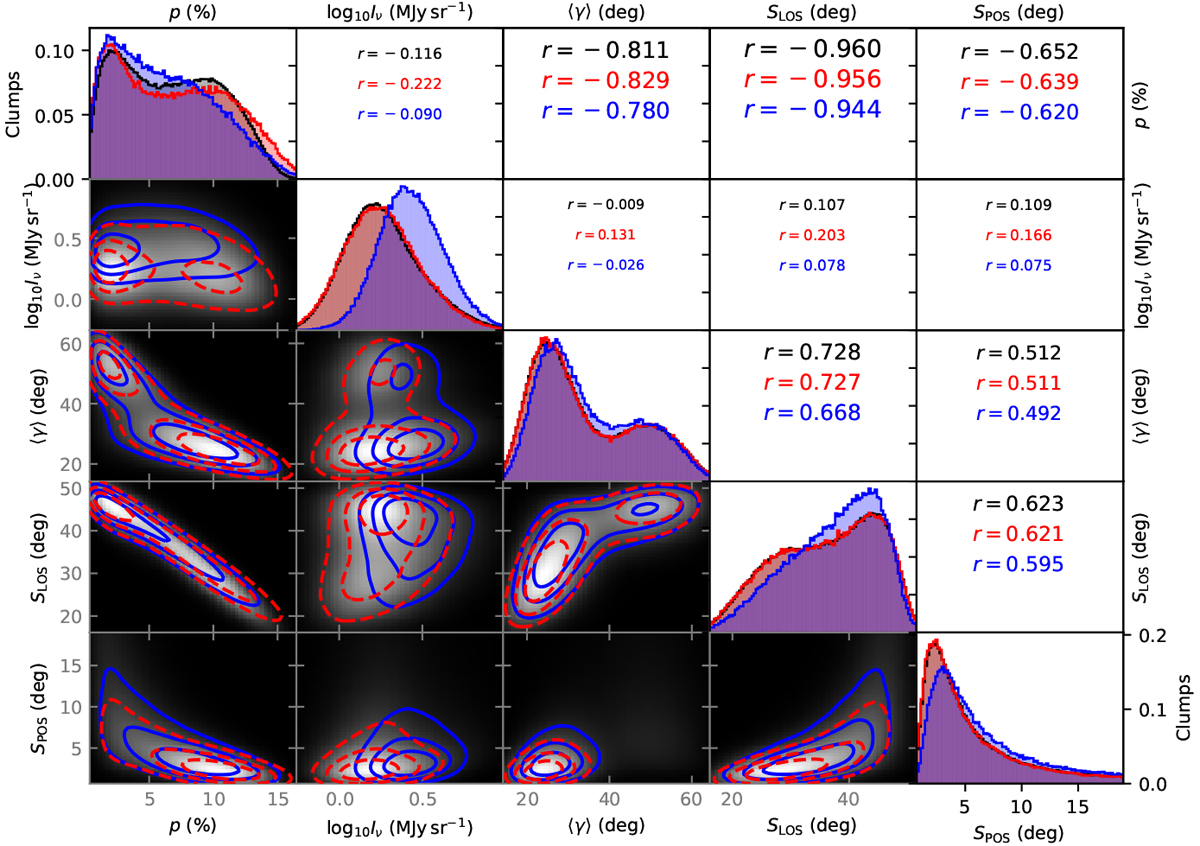
Comparison of polarisation-related parameters for alternative models. The lower frames show kernel-density-estimated parameter correlations and the diagonal frames the histograms of individual parameters. The correlation coefficients are listed in the remaining frames. The background images and histograms drawn with black lines correspond to the default model D with all clumps d < 300 pc. The data for the alternative models H (internal heating sources) and M5 (modified dust properties) are drawn in red and blue, respectively.
Current usage metrics show cumulative count of Article Views (full-text article views including HTML views, PDF and ePub downloads, according to the available data) and Abstracts Views on Vision4Press platform.
Data correspond to usage on the plateform after 2015. The current usage metrics is available 48-96 hours after online publication and is updated daily on week days.
Initial download of the metrics may take a while.