Fig. 18
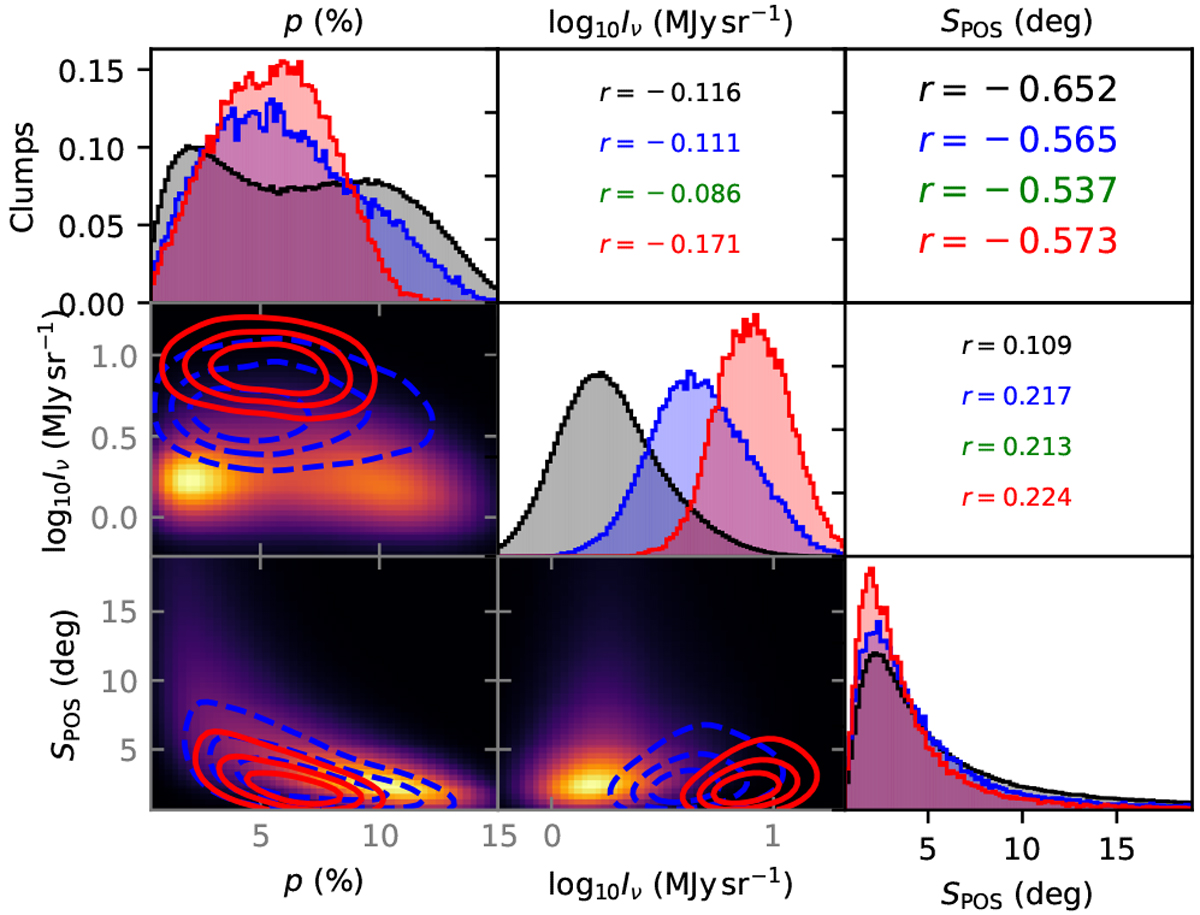
Comparison of p, clump 850 μm intensity Iν, and SPOS for default model and longer LOS cases. The background images and the black histograms correspond to the default model and the blue and red histograms, respectively, to the L = 2 and L =4 models. From top to bottom: correlation coefficients are listed for the default case and the L = 2, 3, and 4 cases. The plot includes all clumps at d ≤ 231 pc.
Current usage metrics show cumulative count of Article Views (full-text article views including HTML views, PDF and ePub downloads, according to the available data) and Abstracts Views on Vision4Press platform.
Data correspond to usage on the plateform after 2015. The current usage metrics is available 48-96 hours after online publication and is updated daily on week days.
Initial download of the metrics may take a while.