Fig. 17
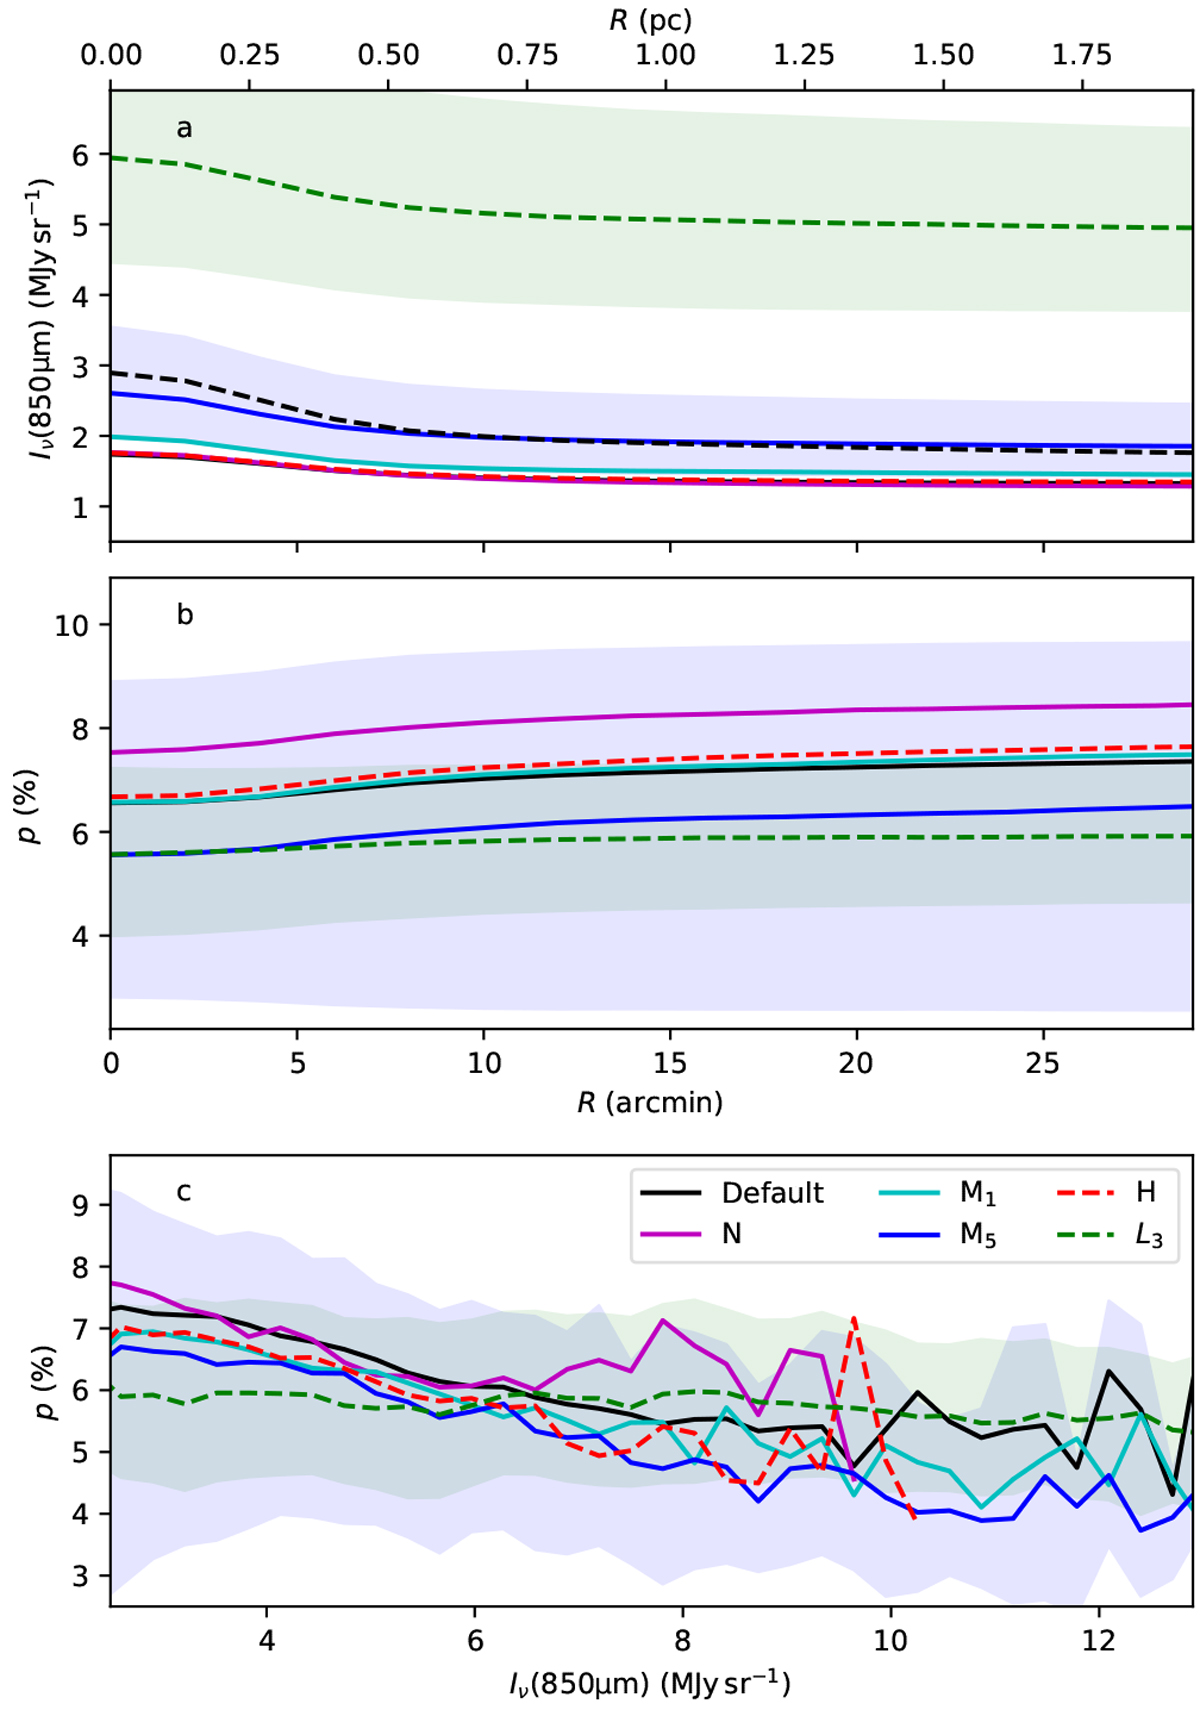
Radial profiles and correlation between polarisation fraction and surface brightness for alternative models with d = 231 pc, as indicated in the last frame. The shaded regions correspond to the inter-quartile intervals for the models L3 (green) and M5 (blue). Frames a and b: additional curves for a S/N > 10, Td < 13 K sub-sample of the default case (dashed black lines). In frame b, these are on top of each other. Frame c: curves for the default and H cases also overlap.
Current usage metrics show cumulative count of Article Views (full-text article views including HTML views, PDF and ePub downloads, according to the available data) and Abstracts Views on Vision4Press platform.
Data correspond to usage on the plateform after 2015. The current usage metrics is available 48-96 hours after online publication and is updated daily on week days.
Initial download of the metrics may take a while.