Fig. 16
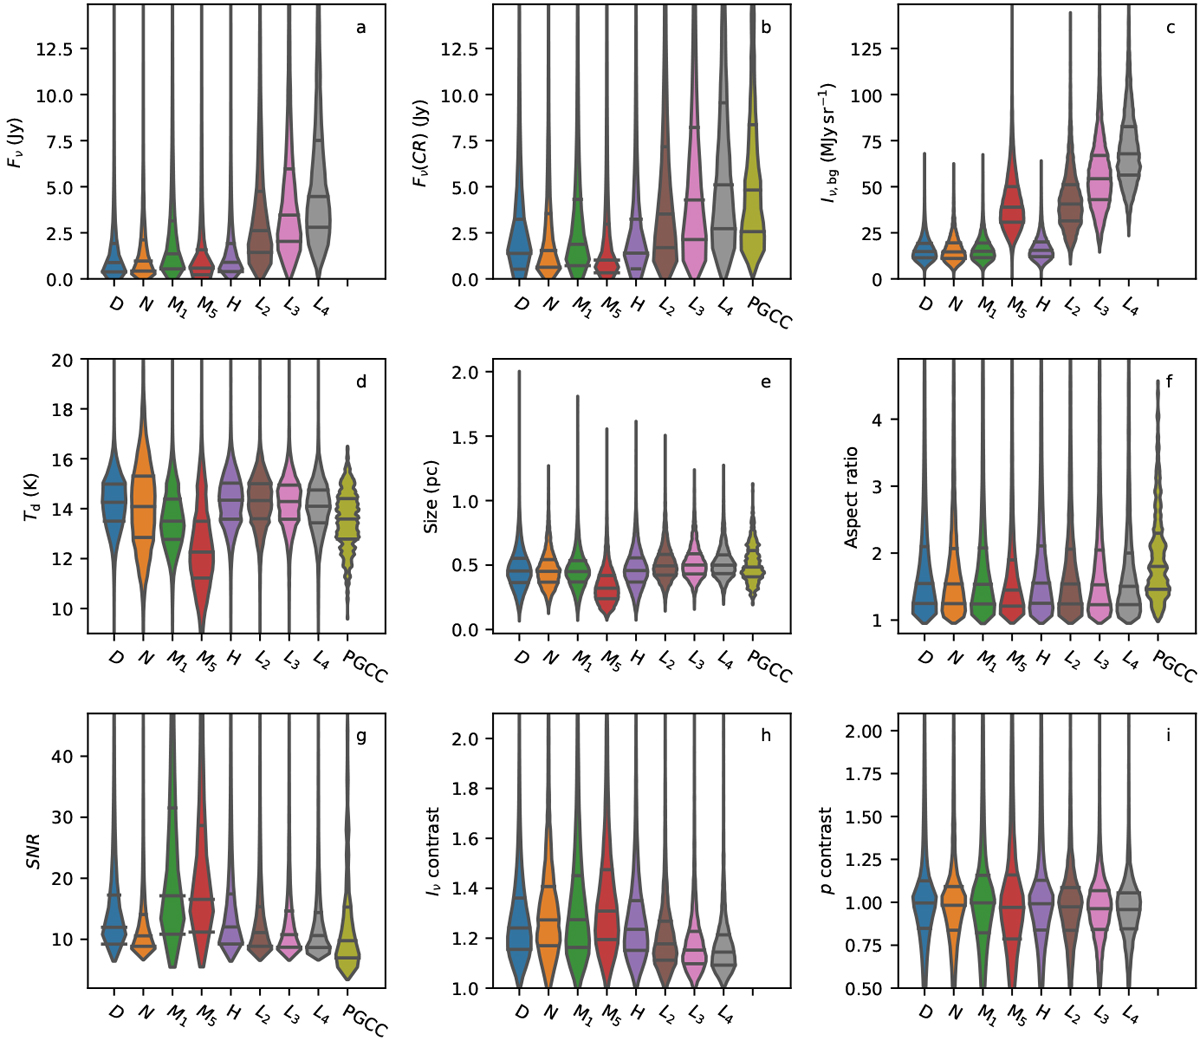
Comparison of parameters for alternative models. Each frame shows parameter distributions for the models (see Table 1) and for the PGCC. The distributions are plotted using kernel density estimates (“violin plots”) with the quartile points indicated with horizontal lines. Frames a–i: clump 850 μm flux density, 850 μm flux density in the cold residual map, 100 μm background intensity, clump temperature, physical size, and aspect ratio, detection S/N, and the intensity and polarisation fraction contrasts (calculated as ratios of the mean values at radiae R < 4 ′ and R =10′–16′). Model results are for the distance of d = 231 pc. The PGCC distributions are plotted for selected quantities, for clumps with FLUX_QUALITY=1 and distance estimates within a factor of 1.5 of the nominal distance.
Current usage metrics show cumulative count of Article Views (full-text article views including HTML views, PDF and ePub downloads, according to the available data) and Abstracts Views on Vision4Press platform.
Data correspond to usage on the plateform after 2015. The current usage metrics is available 48-96 hours after online publication and is updated daily on week days.
Initial download of the metrics may take a while.