Fig. 10
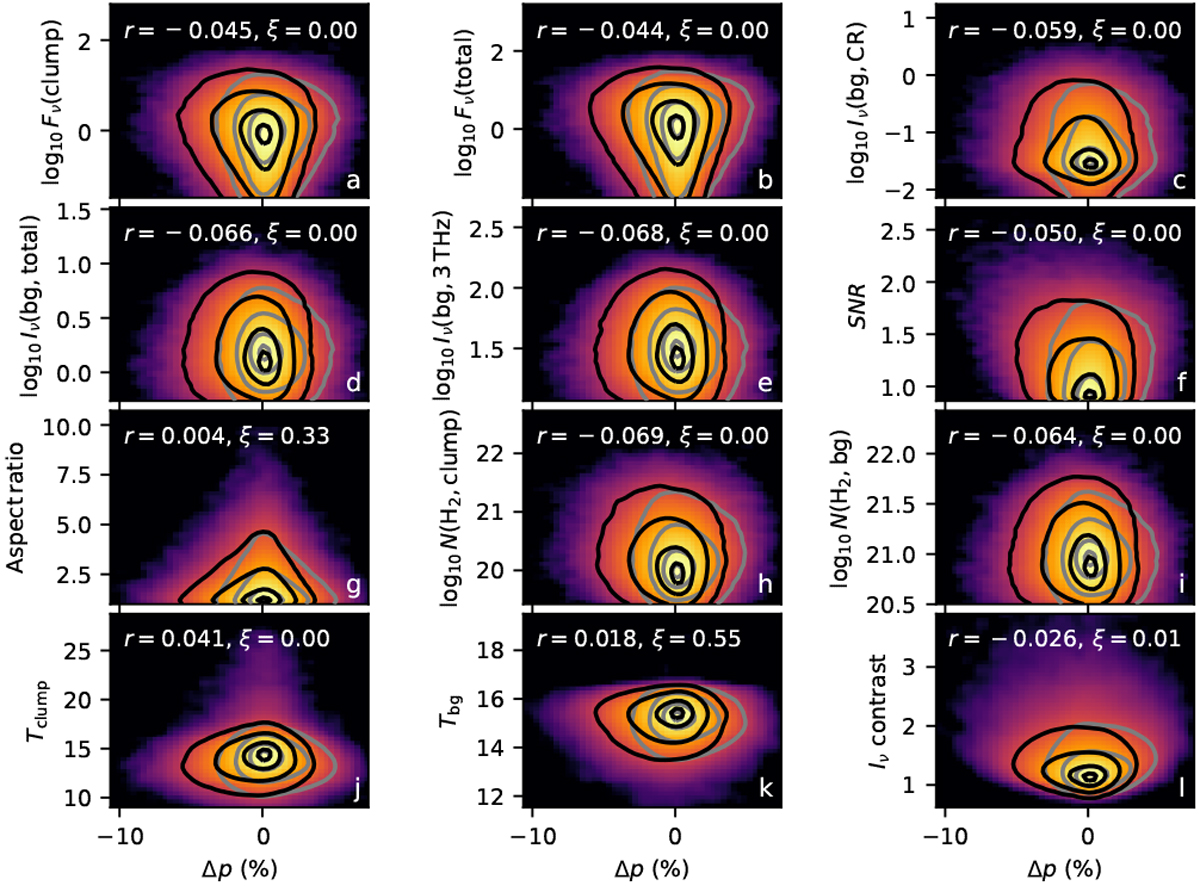
Correlations between various parameters and Δp, the drop in polarisation towards centre of d ≤ 231 pc clumps (see text). The colour images show logarithmic point density for the clumps from Figs. 8a–c. The frames quote the linear correlation coefficients r. Probabilities ξ for r to be consistent with zero are computed for a factor of 100 smaller random clump samples. The black contours show the distribution for the combination of view directions x and z and the grey contours for the direction y. The contours are at 0.01, 0.1, 0.5, and 0.9 times the peak value. If not otherwise specified, the intensities and flux densities are the 850 μm values.
Current usage metrics show cumulative count of Article Views (full-text article views including HTML views, PDF and ePub downloads, according to the available data) and Abstracts Views on Vision4Press platform.
Data correspond to usage on the plateform after 2015. The current usage metrics is available 48-96 hours after online publication and is updated daily on week days.
Initial download of the metrics may take a while.