Fig. 1
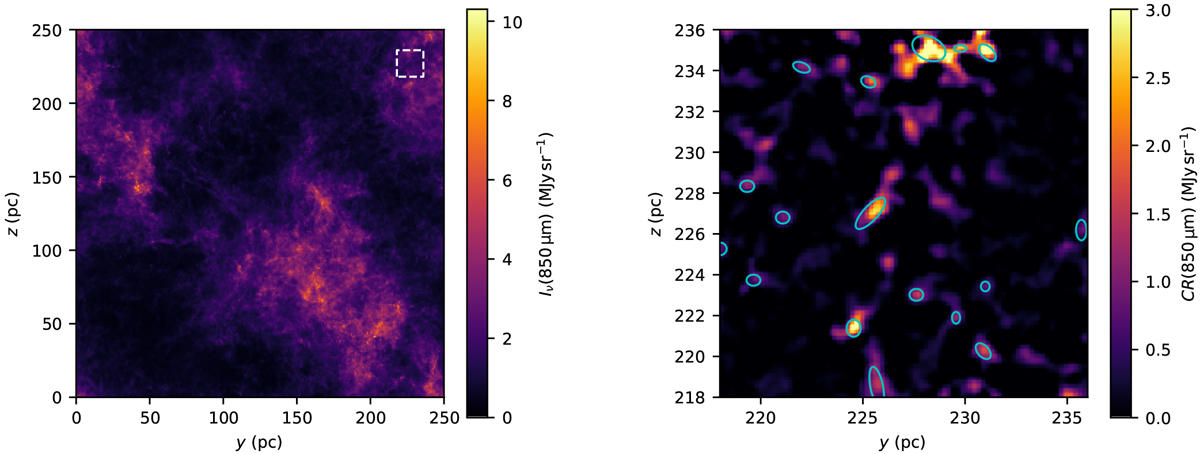
Example of surface brightness data and clump extraction. Left frame: 850 μm map of one snapshot (number 377), with the view direction x and assumeddistance of d = 351 pc. Right frame:cold residual at 350 μm (857 GHz) for the area indicated with the dashed box in the first frame. The cyan ellipses correspond to the clumps that have been detected with S/N above four at all three Planck wavelengths and have reliable photometry in those bands and at 100 μm.
Current usage metrics show cumulative count of Article Views (full-text article views including HTML views, PDF and ePub downloads, according to the available data) and Abstracts Views on Vision4Press platform.
Data correspond to usage on the plateform after 2015. The current usage metrics is available 48-96 hours after online publication and is updated daily on week days.
Initial download of the metrics may take a while.