Free Access
Fig. 8.
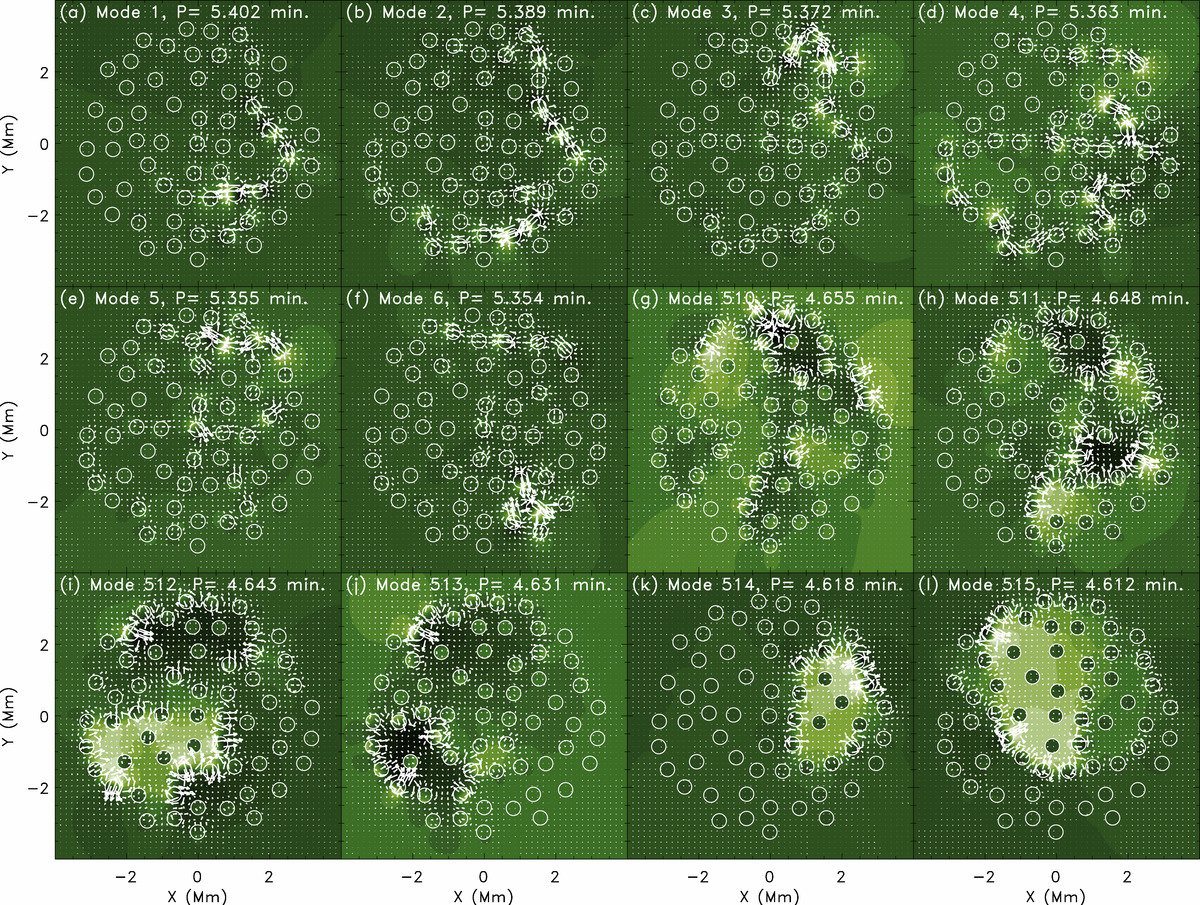
Similar to Fig. 3 showing some normal modes of the identical strand distribution but with a random density distribution from 3.220ρc to 3.815ρc. The first six Low modes are plotted in panelsa–f whereas the last six High modes are in panelsg–l.
Current usage metrics show cumulative count of Article Views (full-text article views including HTML views, PDF and ePub downloads, according to the available data) and Abstracts Views on Vision4Press platform.
Data correspond to usage on the plateform after 2015. The current usage metrics is available 48-96 hours after online publication and is updated daily on week days.
Initial download of the metrics may take a while.