Fig. 6.
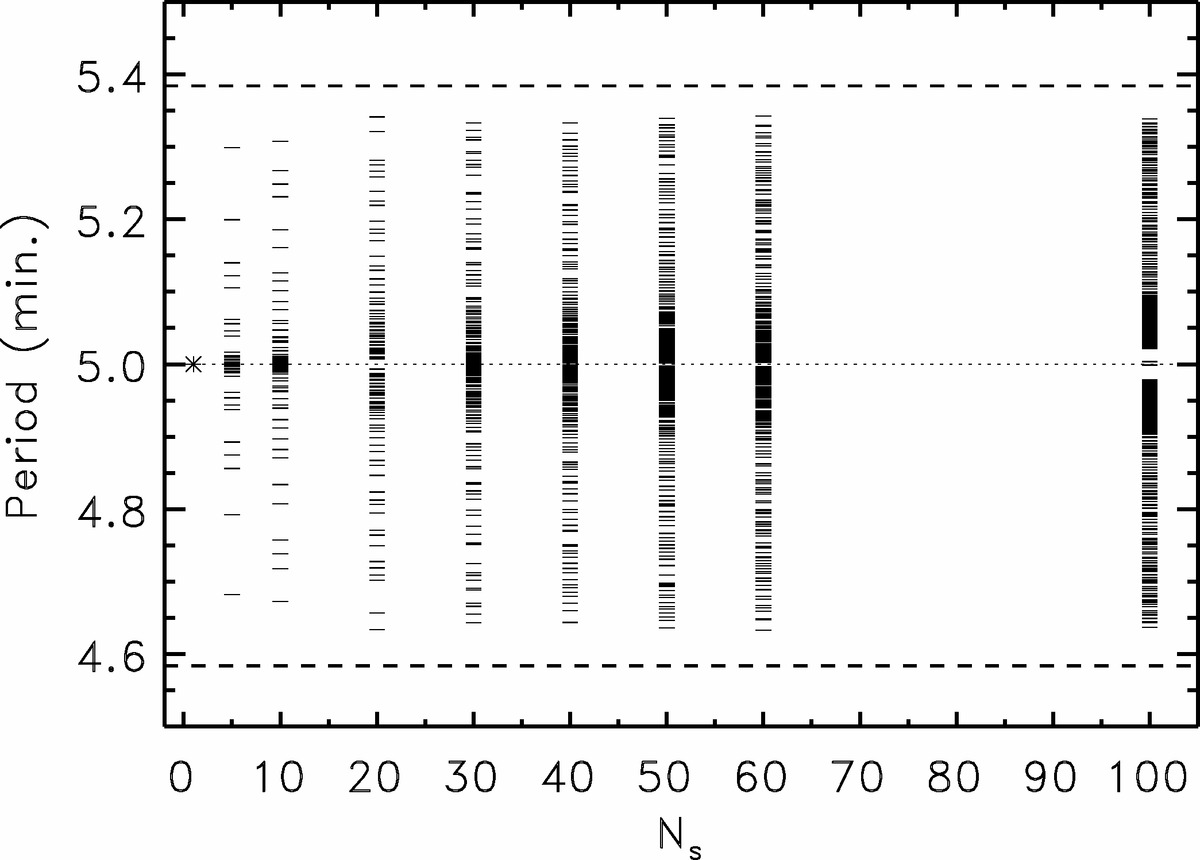
Scatter plot of the normal mode periods of the systems considered a function of the number of strands, Ns = 1, 5, 10, 20, 30, 40, 50, 60, and 100. Each period is drawn as a small horizontal line except the case of Ns = 1 where an asterisk is used. The horizontal dotted line is the period of oscillation of an individual strand, Ps = 5 min. Both horizontal dashed lines are the analytic approximate expressions for PH and PL from Eq. (13). In all the situations the number of modes increases with the proximity to Ps and the plot looks like a continuous dark band. In the case of 100 strands, there is a gap associated with a numerical issue in the T-method. Near the central frequency, the T-matrix becomes singular and the method fails near the singularity.
Current usage metrics show cumulative count of Article Views (full-text article views including HTML views, PDF and ePub downloads, according to the available data) and Abstracts Views on Vision4Press platform.
Data correspond to usage on the plateform after 2015. The current usage metrics is available 48-96 hours after online publication and is updated daily on week days.
Initial download of the metrics may take a while.