Fig. 5.
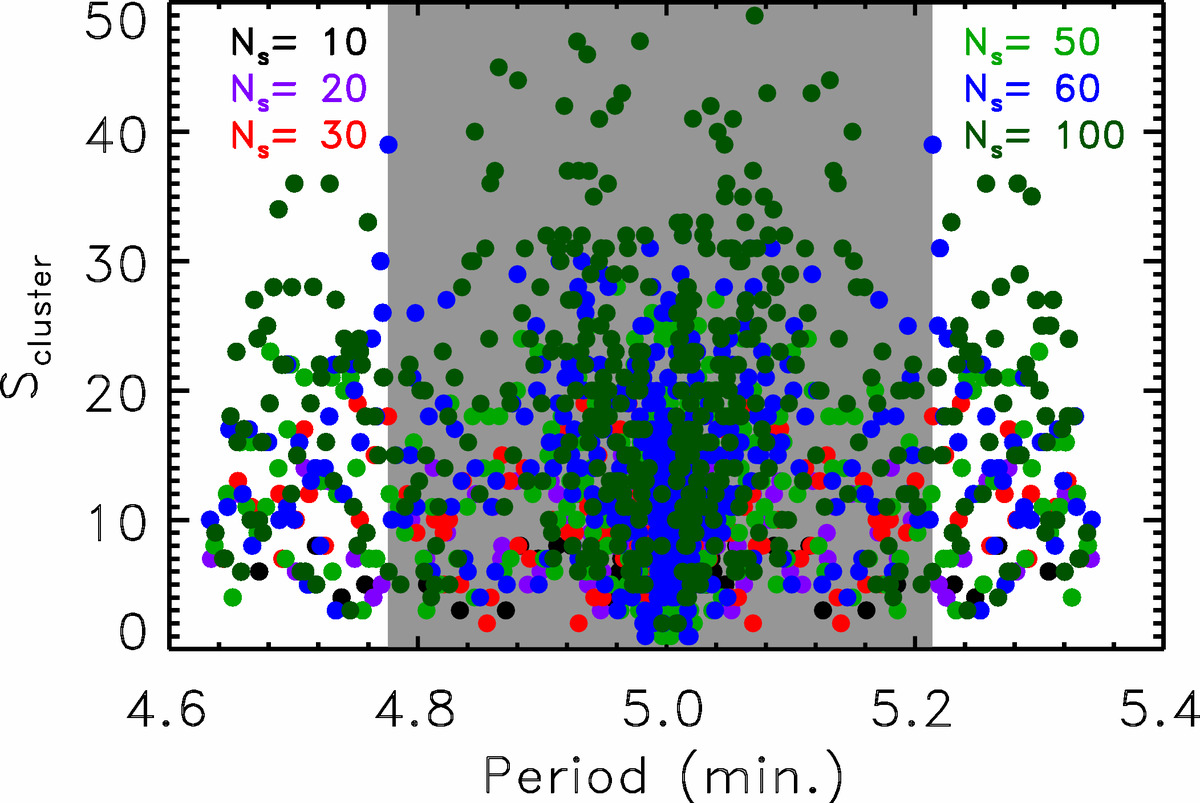
Scatter plot of the approximate sizes of the cluster of strands of each normal mode given by the function Scluster as a function of the mode periods for Ns = 10, 20, 30, 60, and 100 cases in black, magenta, red, green, dark blue, and dark green, respectively. The shared area corresponds to the period range of the Mid modes for Ns = 100.
Current usage metrics show cumulative count of Article Views (full-text article views including HTML views, PDF and ePub downloads, according to the available data) and Abstracts Views on Vision4Press platform.
Data correspond to usage on the plateform after 2015. The current usage metrics is available 48-96 hours after online publication and is updated daily on week days.
Initial download of the metrics may take a while.