Fig. 12.
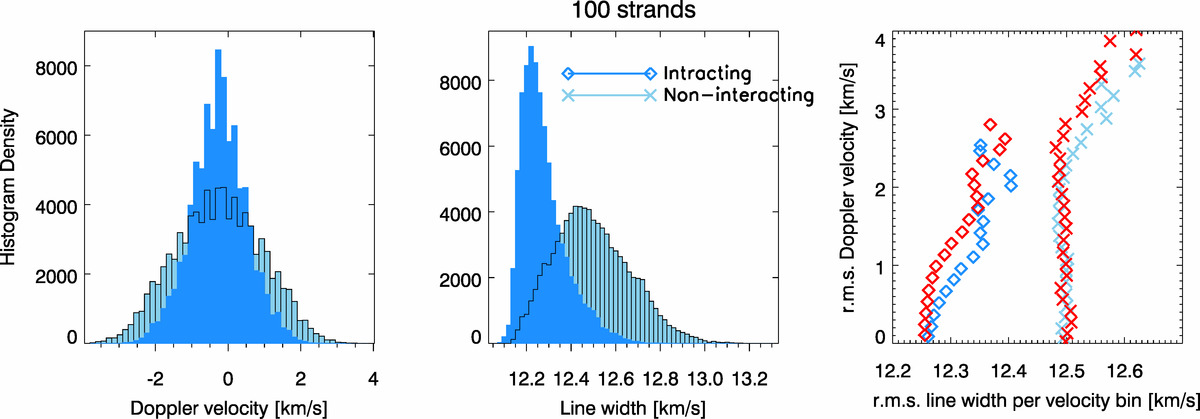
(a) Doppler velocity. (b) Line width distributions for the 100 strand case with interactions (“interacting”) and without interactions (“non-interacting”). (c) rms value in line width for each bin of the velocity histogram against the rms value for the same pixels. Blue and red symbols in this panel correspond, respectively, to positive and negative Doppler velocities.
Current usage metrics show cumulative count of Article Views (full-text article views including HTML views, PDF and ePub downloads, according to the available data) and Abstracts Views on Vision4Press platform.
Data correspond to usage on the plateform after 2015. The current usage metrics is available 48-96 hours after online publication and is updated daily on week days.
Initial download of the metrics may take a while.